Gathering Metrics from Ceph RGW S3
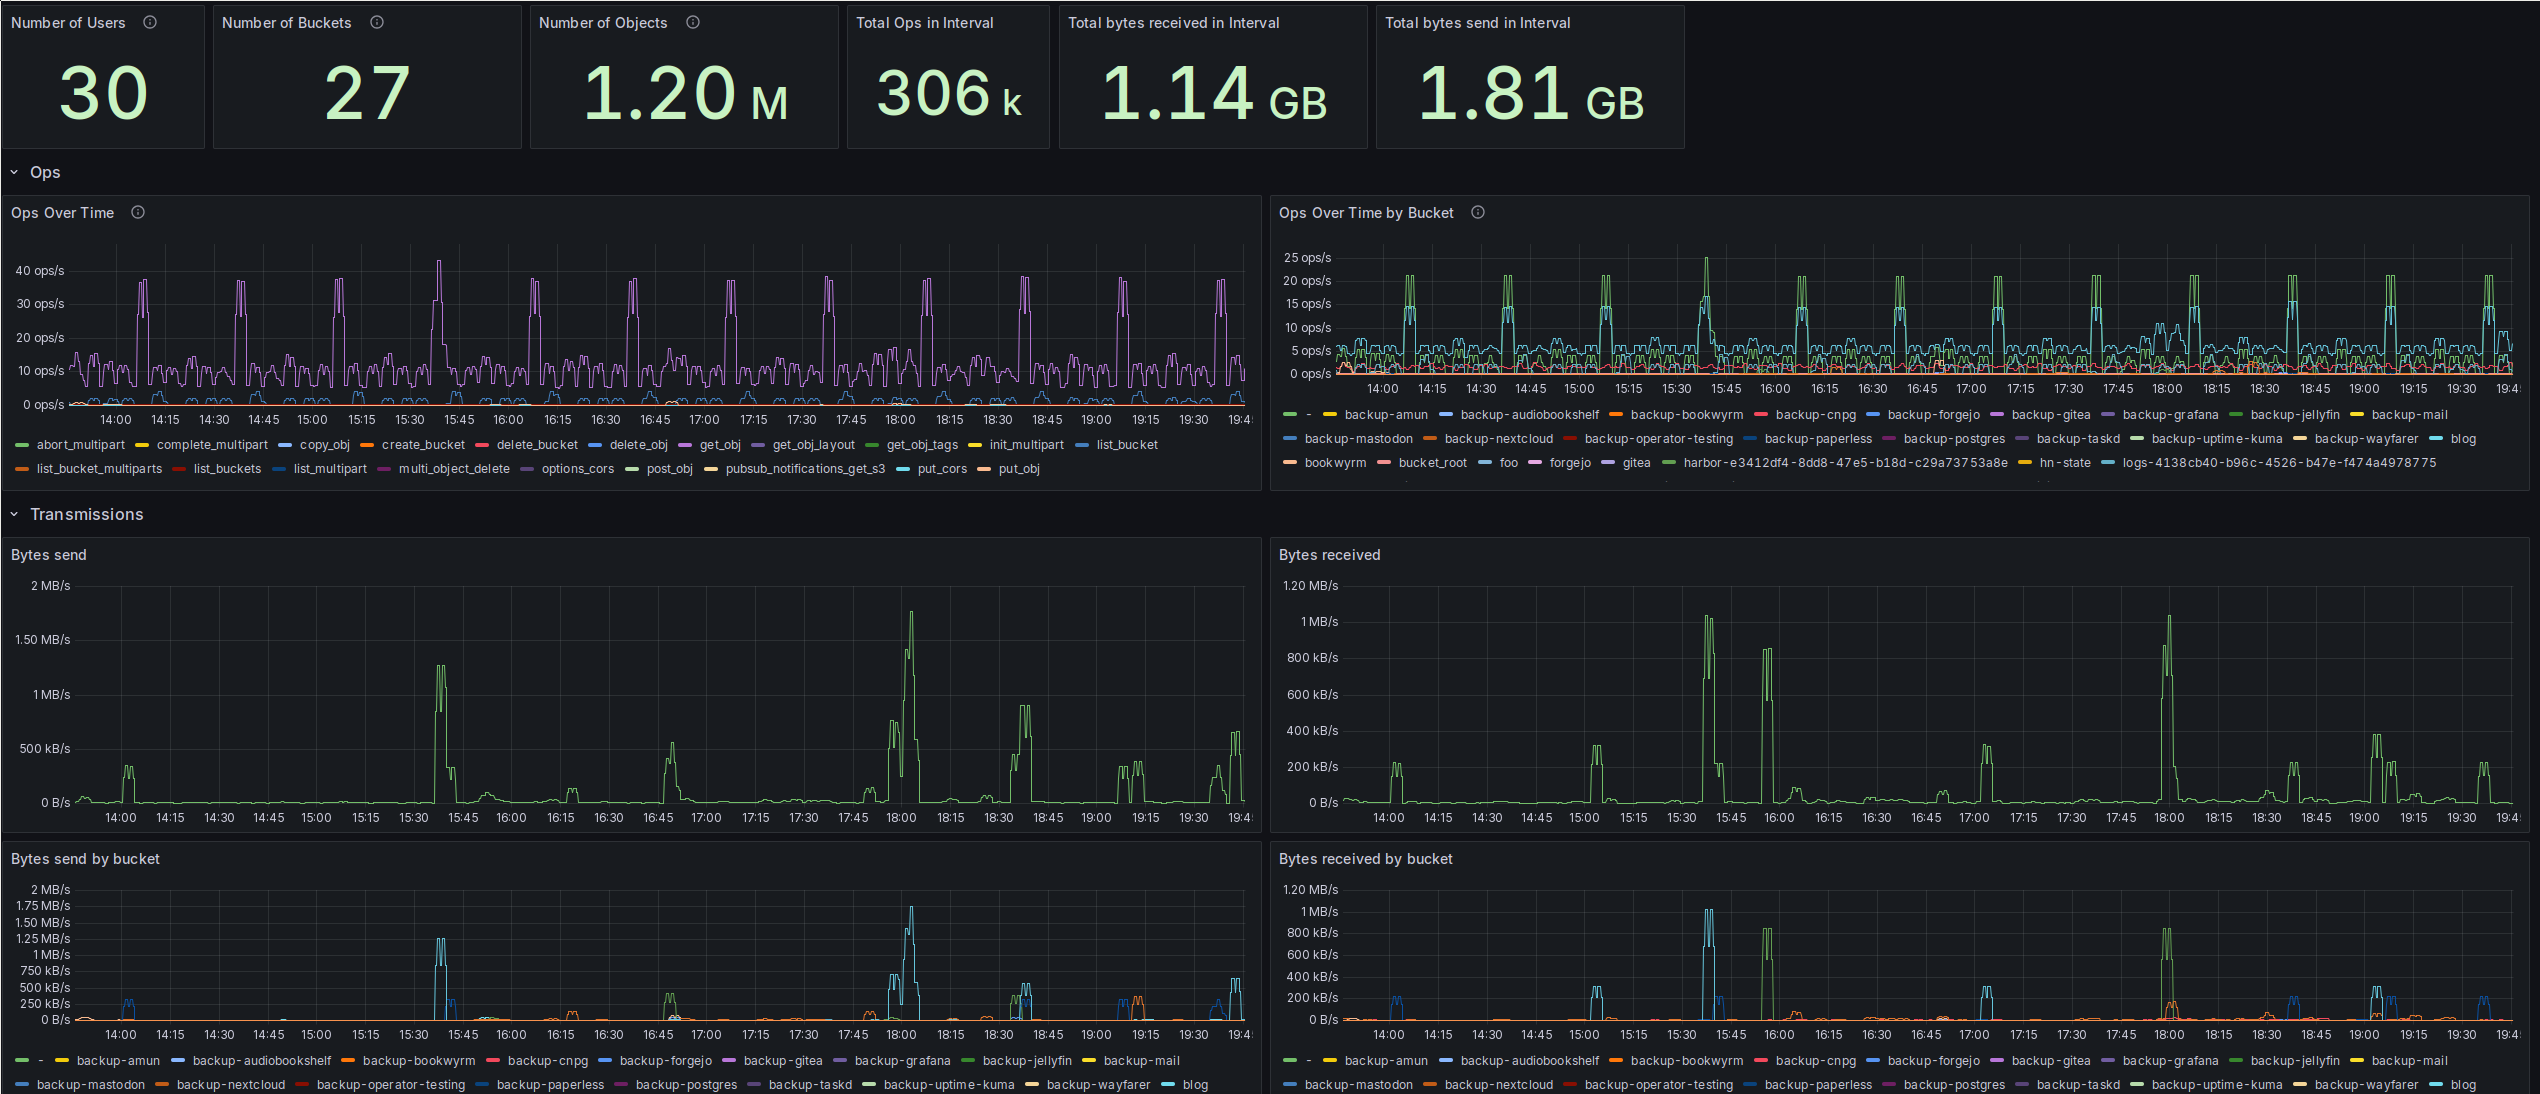
Wherein I set up some Prometheus metrics gathering from Ceph’s S3 RGW and build a dashboard to show the data. I like metrics. And dashboards. And plots. And one of the things I’ve been missing up to now was data from Ceph’s RadosGateway. That’s the Ceph daemon which provides an S3 (and Swift) compatible API for Ceph clusters. While Rook, the tool I’m using to deploy Ceph in my k8s cluster, already wires up Ceph’s own exporters to be scraped by a Prometheus Operator, that does not include S3 data. My main interest here is the development of bucket sizes over time, so I can see early when something is misconfigured. Up to now, the only indicator I had was the size of the pool backing the RadosGW, which currently stands at 1.42 TB, which makes it the second-largest pool in my cluster. ...

