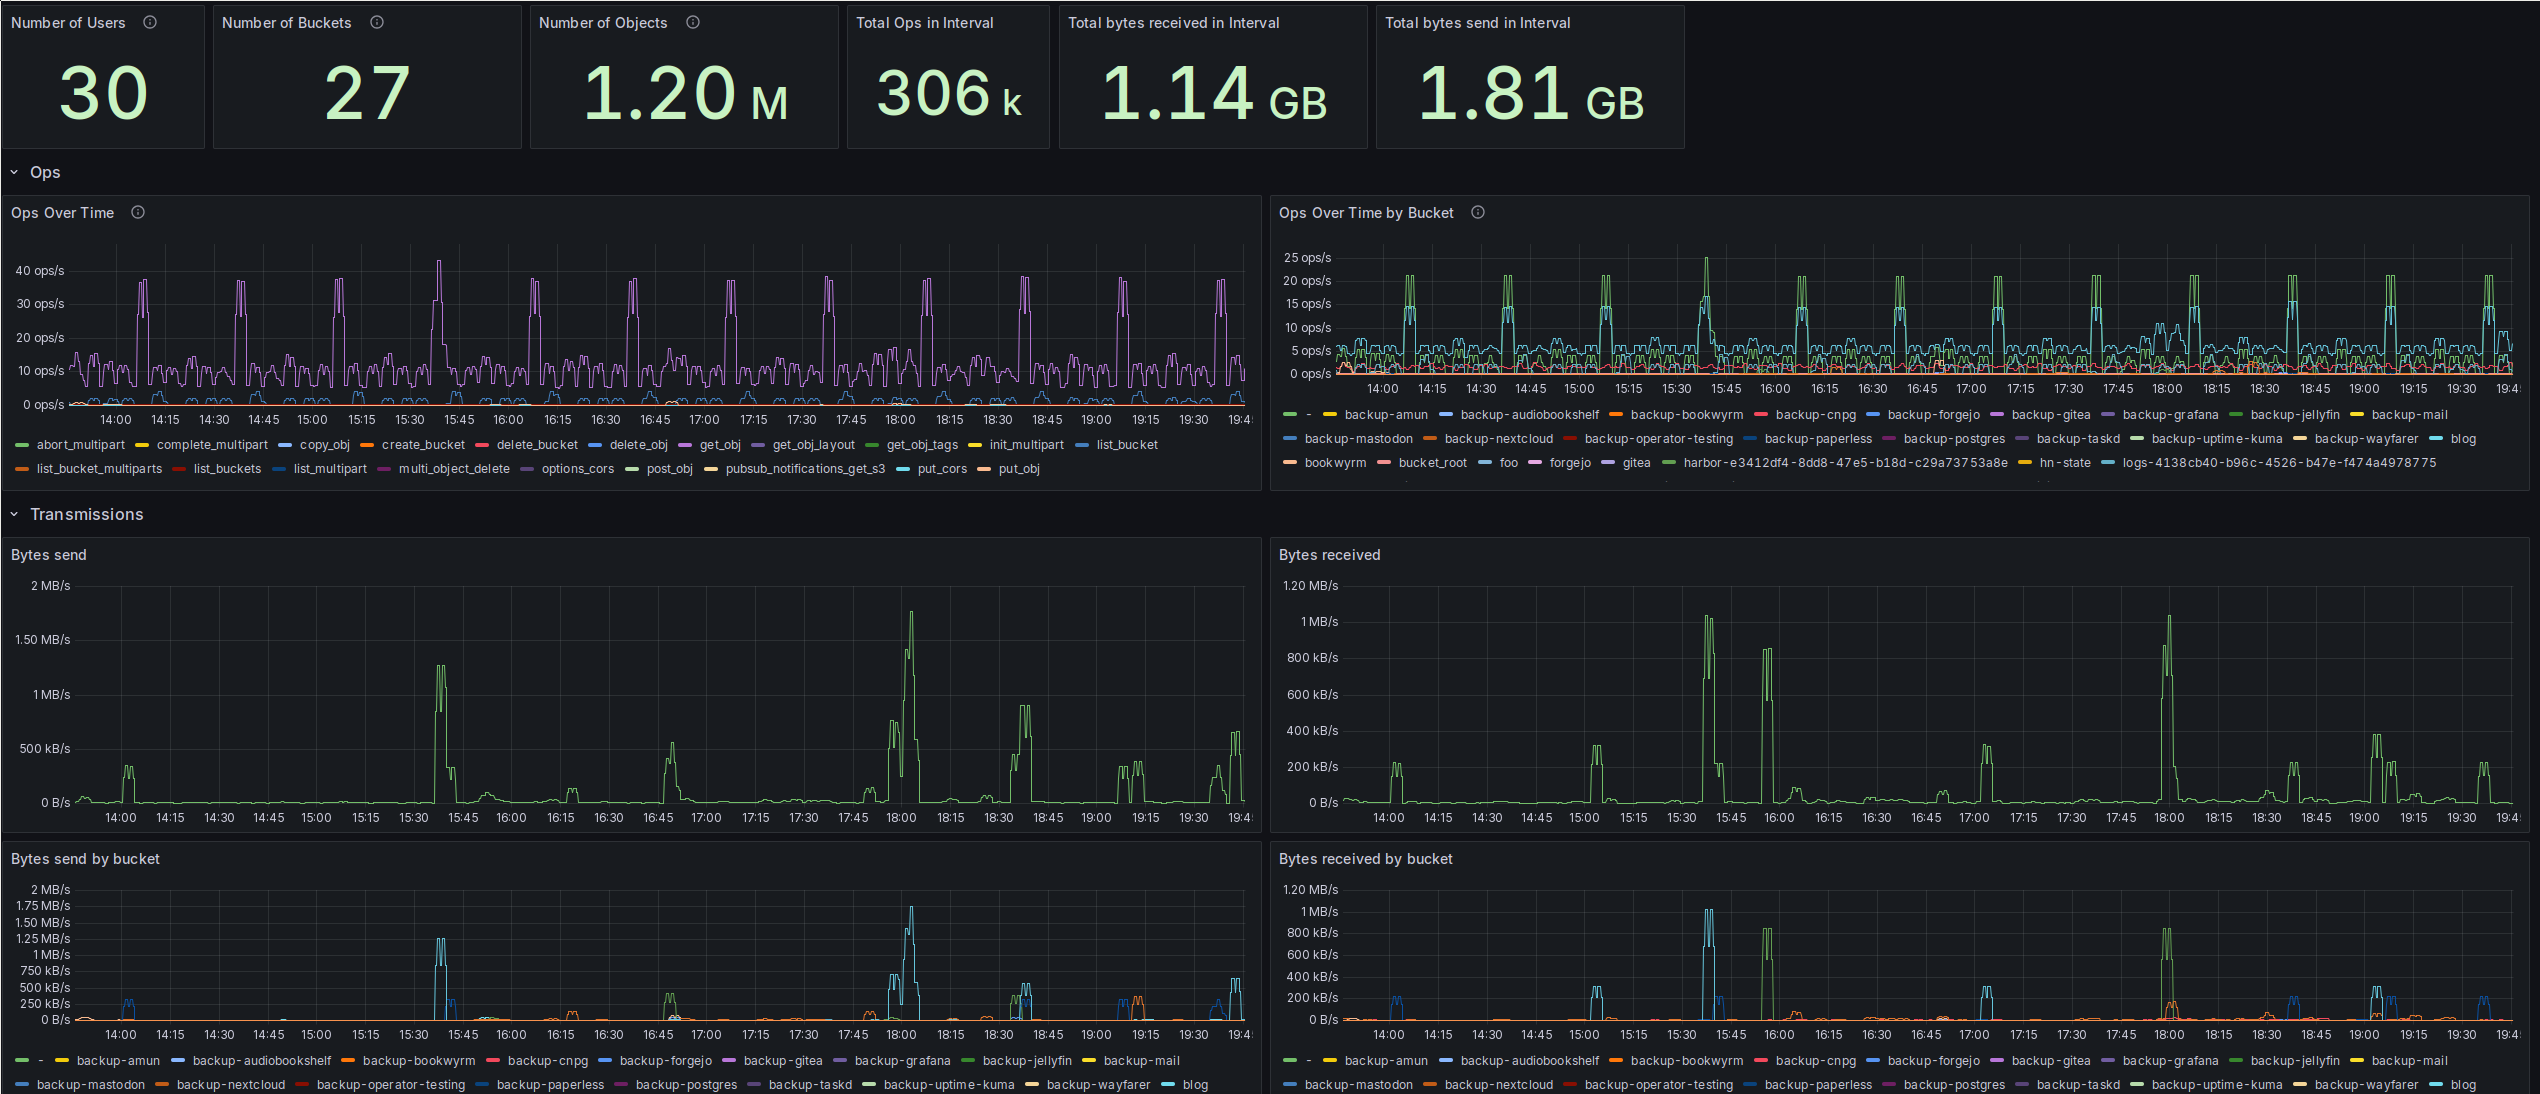
A screenshot of a Grafana dashboard. It shows a number of stats metrics at the top, for example the number of users and buckets and the total bytes send in the interval. Below that, there are a number of time series panels, like number of operations over time, bytes send or bytes received by bucket. I will describe each individual panel and its content in detail in the main post.

Gathering Metrics from Ceph RGW S3

Wherein I set up some Prometheus metrics gathering from Ceph’s S3 RGW and build a dashboard to show the data. I like metrics. And dashboards. And plots. And one of the things I’ve been missing up to now was data from Ceph’s RadosGateway. That’s the Ceph daemon which provides an S3 (and Swift) compatible API for Ceph clusters. While Rook, the tool I’m using to deploy Ceph in my k8s cluster, already wires up Ceph’s own exporters to be scraped by a Prometheus Operator, that does not include S3 data. My main interest here is the development of bucket sizes over time, so I can see early when something is misconfigured. Up to now, the only indicator I had was the size of the pool backing the RadosGW, which currently stands at 1.42 TB, which makes it the second-largest pool in my cluster. ...

October 10, 2025 · 15 min · Michael

Gathering SNMP Metrics with the SNMP Exporter

I have been gathering metrics from my DrayTek Vigor 165 modem for a while now, and finally got around to documenting the setup, so now you get to read about it. I’m using the Vigor 165 to connect to the Internet via a Deutsche Telekom 250 Mbit/s VDSL connection. That modem supports SNMP and can provide metrics like the line speed or quality. A couple of years back, I wanted to get that data into my Grafana dashboards. After some searching, I came across the SNMP Exporter. ...

May 25, 2025 · 11 min · Michael
The Thanos logo. It is a T in a square with some squares under the T. Below that is the 'Thanos' name.

Setting up Thanos for Metrics Storage

At the time of writing, I have 328 GiB of Prometheus data. When it all started, I had about 250 GiB. I could stop gathering more data whenever I like. 😅 So I’ve got a lot of Prometheus data. Especially since I started the Kubernetes cluster - or rather, since I started scraping it - I had to regularly increase the size of the storage volume for Prometheus. This might very well be due to my 5 year retention. But part of it, as it will turn out later, was because some of the things I was scraping had a 10s scrape interval configured. ...

May 18, 2025 · 30 min · Michael
The HashiCorp Nomad and Kubernetes logos, connected with an arrow pointing from Nomad to Kubernetes

Nomad to k8s, Part 21: Replacing Uptime Kuma with Gatus

Wherein I replace Uptime Kuma on Nomad with Gatus on Kubernetes. This is part 22 of my k8s migration series. For my service monitoring needs, I’ve been using Uptime Kuma for a couple of years now. Please have a look at the repo’s Readme for a couple of screenshots, I completely forgot to make some before taking my instance down. 🤦 My main use for it was as a platform to monitor the services, not so much as a dashboard. To that end, I gathered Uptime Kuma’s data from the integrated Prometheus exporter and displayed it on my Grafana Homelab dashboard. ...

March 12, 2025 · 9 min · Michael
The HashiCorp Nomad and Kubernetes logos, connected with an arrow pointing from Nomad to Kubernetes

Nomad to k8s, Part 10: Grafana

Wherein I migrate my Grafana instance over to k8s. This is part 11 of my k8s migration series. I already wrote about my love for metrics in the companion post about the Prometheus setup, so I will spare you my excitement about pretty graphs this time. 😉 For the Grafana setup, I used the kube-prometheus-stack’s integration of the Grafana Helm Chart. Database setup First step is to setup the database for Grafana. You can also run it locally, without an external database. Then, Grafana uses an SQLite DB. But the Postgres database made more sense to me. This was the first deployment of a production database with CloudNativePG and looked like this: ...

April 6, 2024 · 11 min · Michael