Goaccess: A CLI Tool for Webserver Access Log Analysis
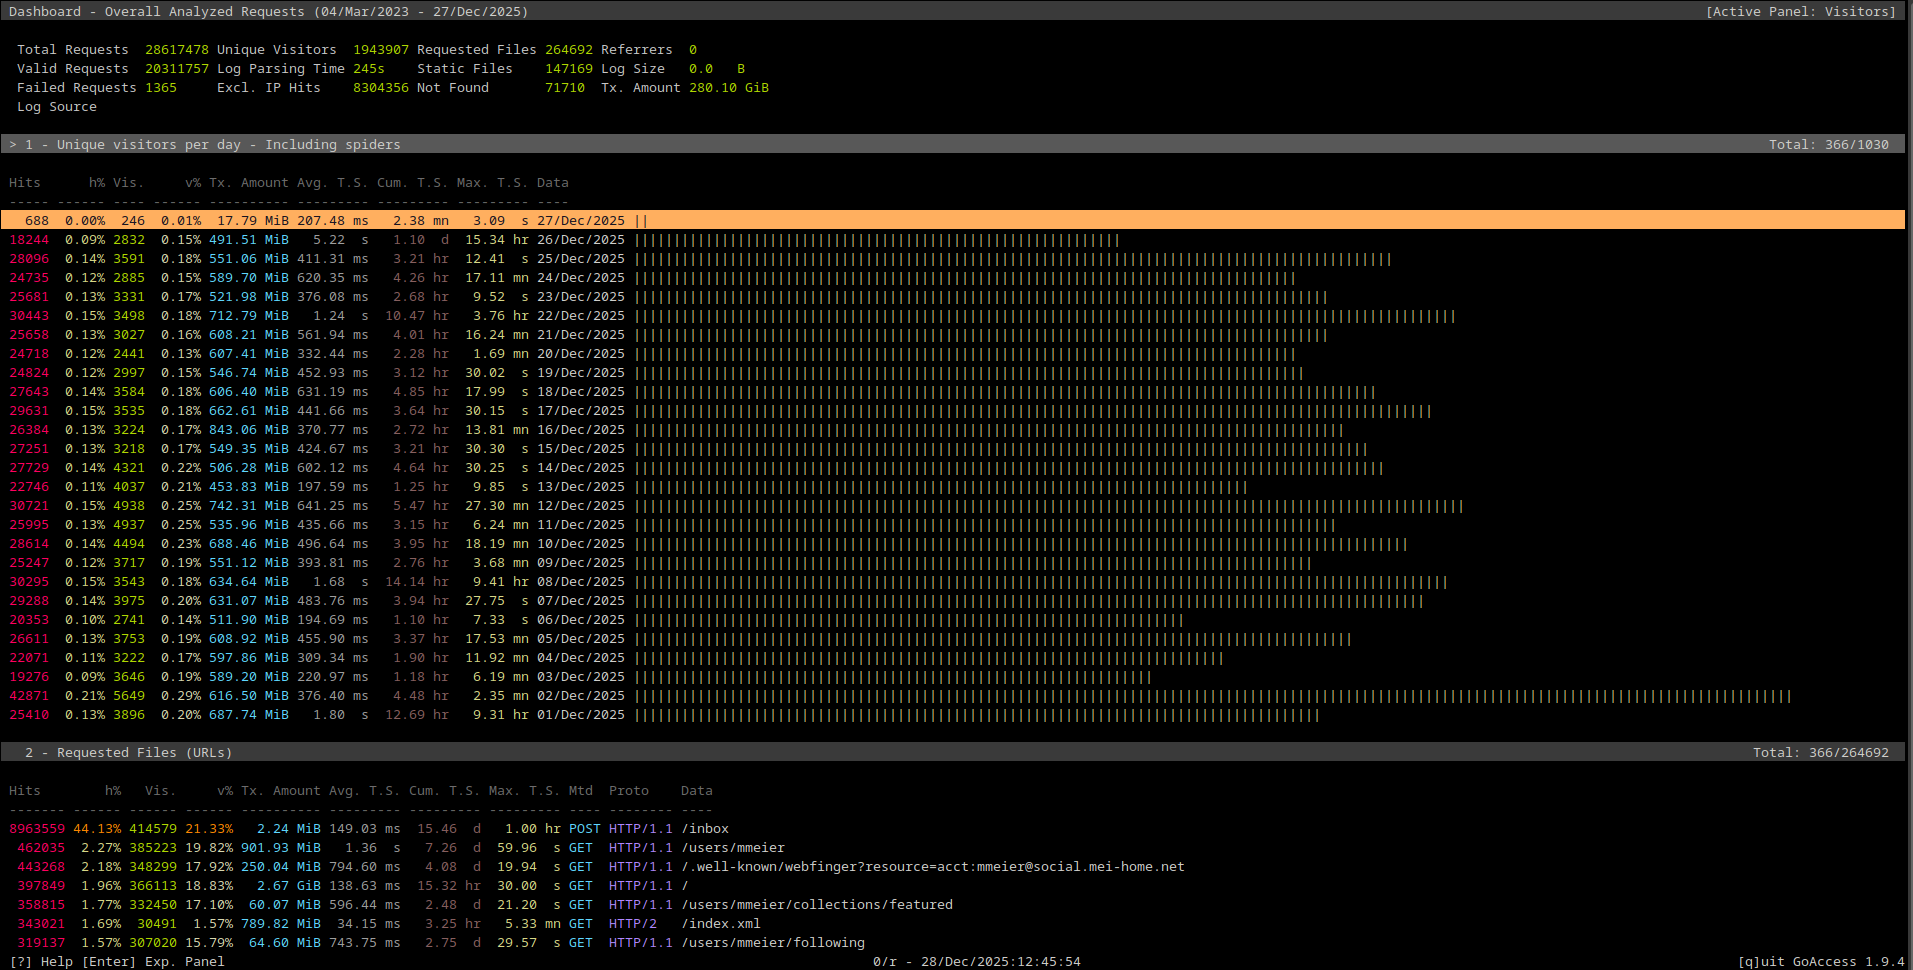
Wherein I talk about a small tool for access log analysis on the terminal. I recently re-discovered a small tool I already came across a while ago, but never wrote a post about: Goaccess. It’s a command line tool which can be used to do quick analysis of web server access logs. It understands some of the standard formats from e.g. Apache out of the box, but also provides facilities to parse other log formats. In this post, I will use it to parse 30 GB worth of logs from my public-facing Traefik instance and see what I can get out of it. ...