I had to clean up my Prometheus data, and it got pretty darned close there.
When it comes to my metrics, I’m very much a data hoarder. Metrics gathering was what got me into Homelabbing as a hobby, instead of just a means to an end. Telegraf/Influx/Grafana were the first new services on my Homeserver in about five years. And I really do like looking at my dashboards, including looking at past data. My retention period currently is five years. And I’m already pretty sure that when I come up to those five years for the initial data, I will just extend that to 10 years. 😅
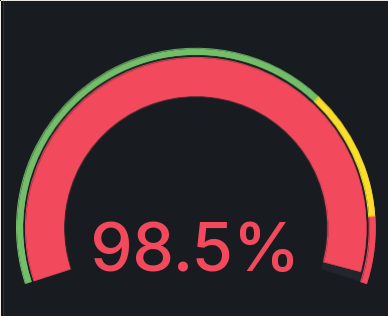
But back in the beginning of June, I hit the 98.5% utilization for the Ceph RBD which was housing my Prometheus TSDB. The volume has 100 GB of available space. And it was full. I migrated Prometheus to my new k8s cluster back in March. In the same setup, I also deployed kube-prometheus-stack, to gather the data from my k8s cluster. At the same time, I’m still gathering data from my Nomad/Consul cluster. I’m also gathering data from two Ceph clusters. One being my old baremetal cluster, and one being my new Ceph Rook cluster. Since the k8s migration started, I’m also gathering data for eight additional hosts. Plus the data from the k8s cluster itself. That additional data has had quite some impact. Here is the growth of the utilization of the volume storing the Prometheus TSDB:
Storage volume utilization of the TSDB
The initial 50%/50GB was the data I had gathered since around February 2021, which was when I initially switched from Influx to Prometheus. The next 50% then came in less than three months. It was clear that I had to slow down the rate of growth.
And so I embarked on a project to drop uninteresting metrics from scraping and deleting the data for those metrics already in Prometheus. My main guidance for this action was this blog post.
Figuring out what to keep and what to drop
The first step was to take inventory. Tanmay was describing a method to find the most costly metrics in their post, but I wasn’t really after costly metrics, just ones I knew I was not interested in now and probably would never be interested in in the future. This took some thinking, because what if I suddenly realized a metric is super interesting but don’t have five years worth of data on it?!
The horror! 😱
But before I could start, I had to port-forward the Prometheus port to my local machine, because Prometheus is not directly accessible outside the cluster:
kubectl port-forward -n monitoring prometheus-monitoring-kube-prometheus-prometheus-0 28015:9090
First step, getting all the metric series currently in the TSDB:
curl http://localhost:28015/api/v1/label/__name__/values | tr ',' '\n' | tr -d '"' > all.txt
This produces a list with all of the series names, like this:
apiserver_client_certificate_expiration_seconds_bucket
apiserver_client_certificate_expiration_seconds_count
apiserver_client_certificate_expiration_seconds_sum
apiserver_current_inflight_requests
apiserver_current_inqueue_requests
This resulted in a grant total of 3455 metrics. And remember, those are entire metrics - not unique permutations of labels!
Because I didn’t have any good way to make a decision just from the series name, I went through each and every one of them and plonked them into Grafana’s explore tab and looked at them.
In the end, I had 1279 metrics I wanted to keep, and 3176 I wanted to drop. But before I went and deleted the series from Prometheus, I had to stop Prometheus from scraping them. The overwhelming majority of metrics I wanted to drop came from my Ceph clusters and the k8s cluster itself.
To drop a metric, you can use Prometheus’ metric relabeling
with the drop action. Let’s say you want to drop all VolumeAttachment
metrics, you could add the following list item to the metricRelabelings of the
corresponding ServiceMonitor:
- action: drop
  regex: 'kube_volumeattachment_.*'
  sourceLabels: [__name__]
It’s important to note that this does not stop Prometheus from scraping the metric. The metric just isn’t written to the database, and is instead dropped.
I could comfortably add all the k8s metrics I wanted to drop into the values.yaml
for the kube-prometheus-stack Helm chart. The only thing to look out for is that
there are ServiceMonitors for each individual k8s component, e.g. kube-scheduler,
apiserver and etcd all have their own. To figure out into which ServiceMonitor
a specific metric drop belongs, it helps to look at the job label, which
contains the k8s component which produced the metric.
But watch out! Some metrics are actually produced by more than one component, so
check all the label values, not just the most recently scraped one.
Also look out for the names of the metrics. For example, just because a metric
starts with apiserver_ doesn’t necessarily mean that it is produced by the
apiserver and hence should be dropped there.
As I mentioned above, Ceph was the other big source of drop-able metrics. But here, I hit a severe disappointment: As nice as rook is, it doesn’t currently support configuring the ServiceMonitors it creates, at all. So while I could drop the unwanted metrics for my baremetal cluster, the same metrics are still gathered for the Ceph Rook cluster. I will have to look into that in the near future.
Overall, this was a pretty time consuming procedure, but at least at the end I was pretty happy with the amount of metrics I was able to drop.
I’ve just done another very “rough and ready” check, and it seems that my dropping of metrics did not actually slow the growth down that much. Before I started dropping all those metrics, the disk usage was growing at about 600 MB per 24h. Now it’s at approximately 500 MB per 24h. Not really that much gain, to be honest.
Deleting unwanted metrics
Deleting unwanted data in Prometheus is a two-step process. First, the unwanted series need to be marked for deletion with the Prometheus API. Once that’s done, the metrics need to actually be deleted, again with the Prometheus API.
Because I already had the metrics to be deleted nicely listed in a file with one metric name per line, I wrote a quick bash script to automate the deletion:
#! /bin/bash

PROMETHEUS_SERVER="http://localhost:28015"
metrics_list="${1}"

while read metric; do
  echo "$metric"
  curl -X POST -g "${PROMETHEUS_SERVER}/api/v1/admin/tsdb/delete_series?match[]=${metric}"
done <$metrics_list
curl -X POST -g "${PROMETHEUS_SERVER}/api/v1/admin/tsdb/clean_tombstones"
It takes the aforementioned list and calls the series deletion API for each of the lines in that file, assuming that each line only contains the name of a metric to be deleted. Once that’s done, it calls the tombstone cleaning API, which really deletes the series from the TSDB.
The first part of the script ran through perfectly fine for me. But the cleaning of the tombstones failed:
"status":"error","errorType":"internal","error":"clean tombstones: /prometheus/01HSKJ3DX27WGS1NZTS0F87K6V: 2 errors: preallocate: no space left on device; sync /prometheus/01HZW9FS0W6JT1R0YJ1ZTH332N.tmp-for-creation/chunks/000011: file a
And no, I did not accidentally cut off the message there - that’s all the Prom API send. 😁 So I left it too late. Prometheus didn’t even have enough space left on the volume to execute the tombstone deletion.
Prometheus stores data in chunks on the disk, containing all the data for a specific time period. When you delete the data, it has to open every chunk which contains data from the metric to be removed, needs to remove the data and then write out a new chunk. And it did not have enough space left to write out the new chunk while not having deleted the old chunk yet. In the end I capitulated and increased the size of the Prometheus volume again, by another 20 GB. That was enough. This is one of the reasons why I like to use S3 whenever I can. When I run out of space there I just need to throw in another disk, no mucking about with volume sizes.
Increasing the volume size was not entirely simple, because the PVC is controlled not by a manually created manifest or even a Helm chart, but is instead created by the Prometheus operator when running the kube-prometheus-stack. As a consequence, updating the size has to follow a specific process, which is documented here. That was a pretty humiliating defeat. 😦
The tombstone cleanup is also pretty compute and memory intensive. Here’s the CPU consumption of the Prometheus container:
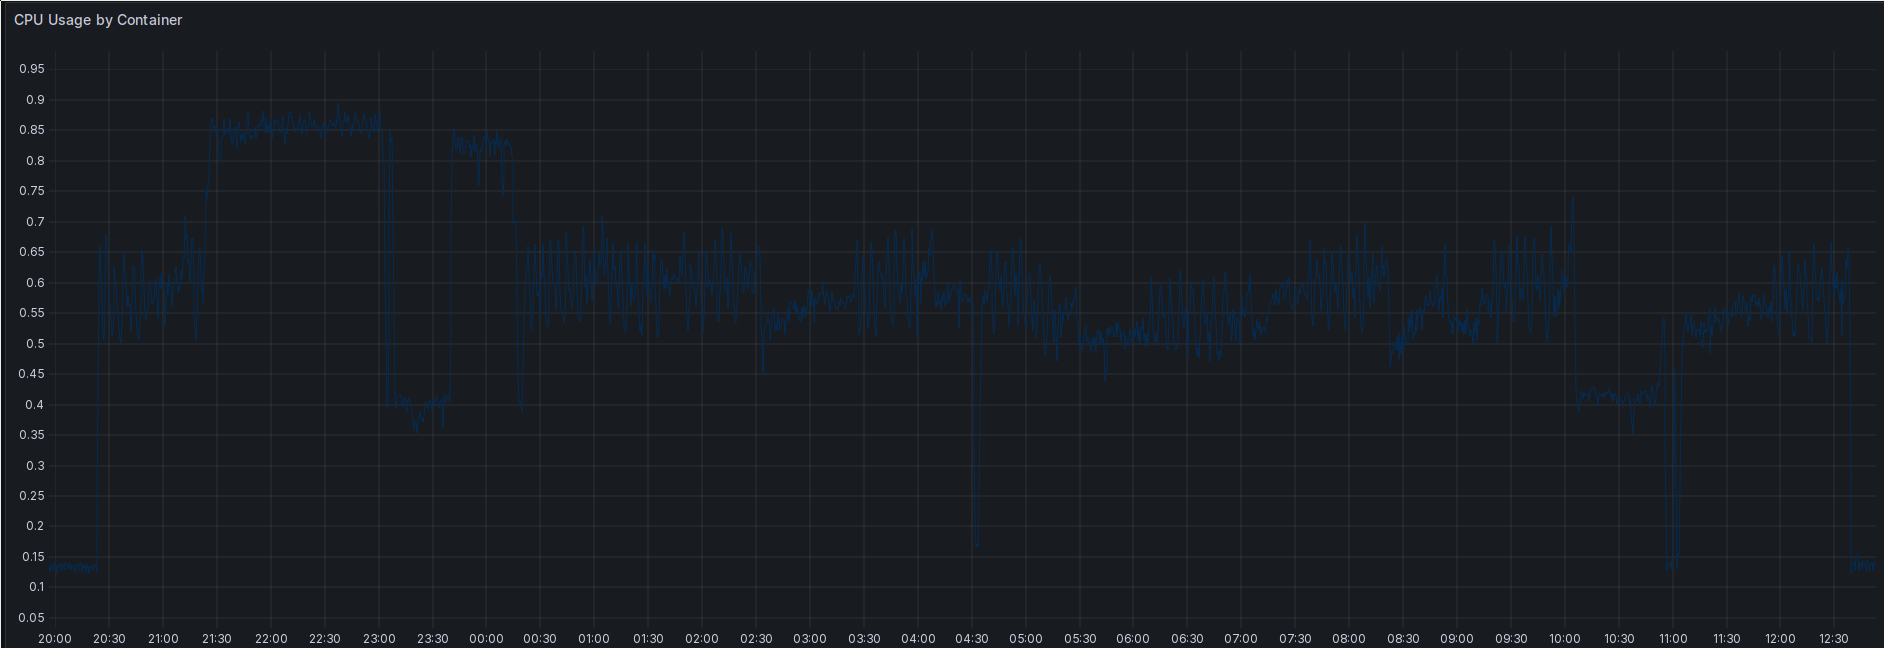
CPU utilization of the Prometheus container during tombstone cleaning.
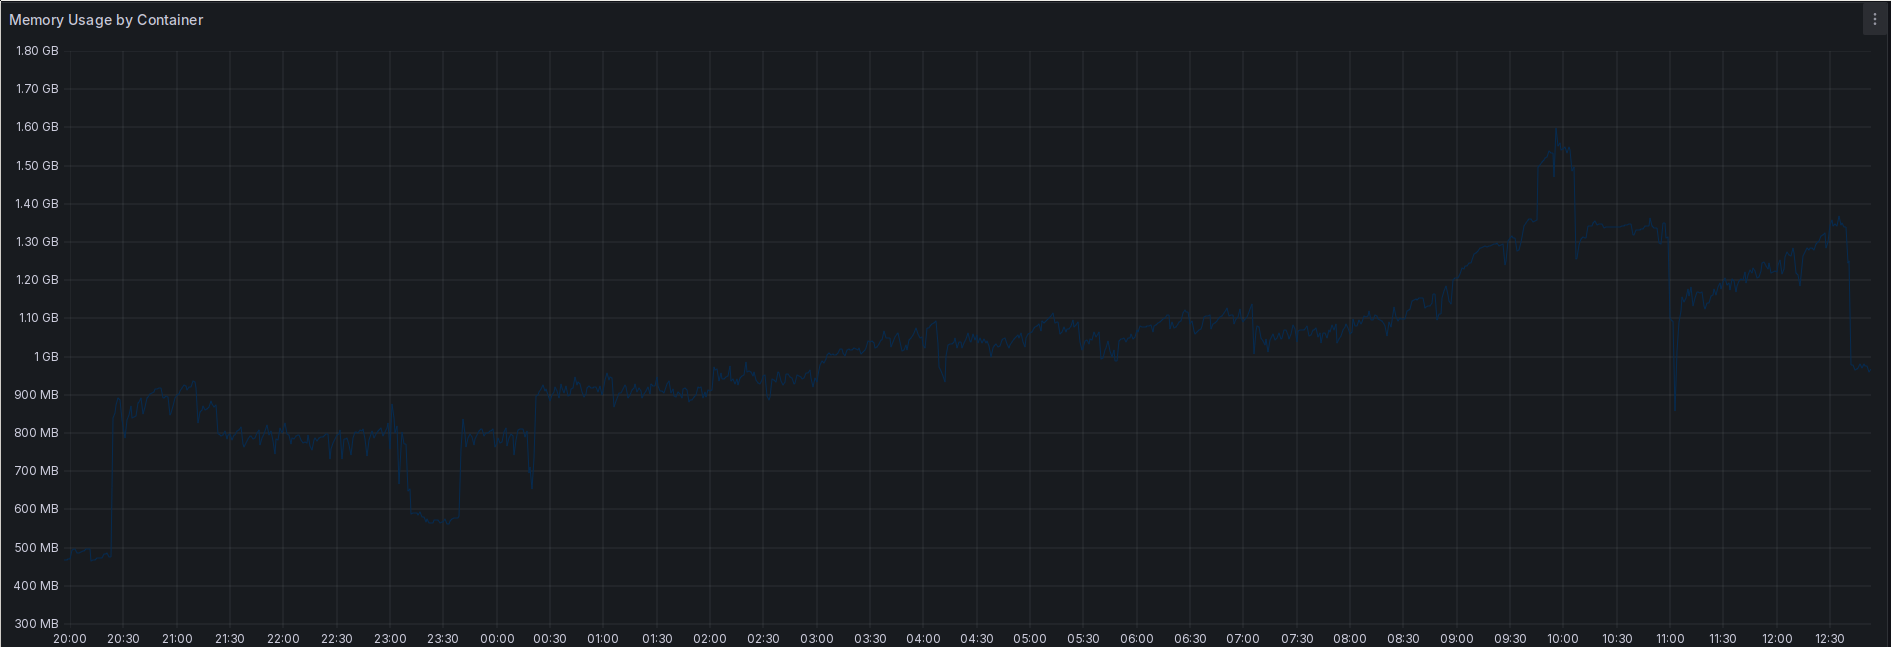
Memory utilization of the Prometheus container during tombstone cleaning.
Future approaches
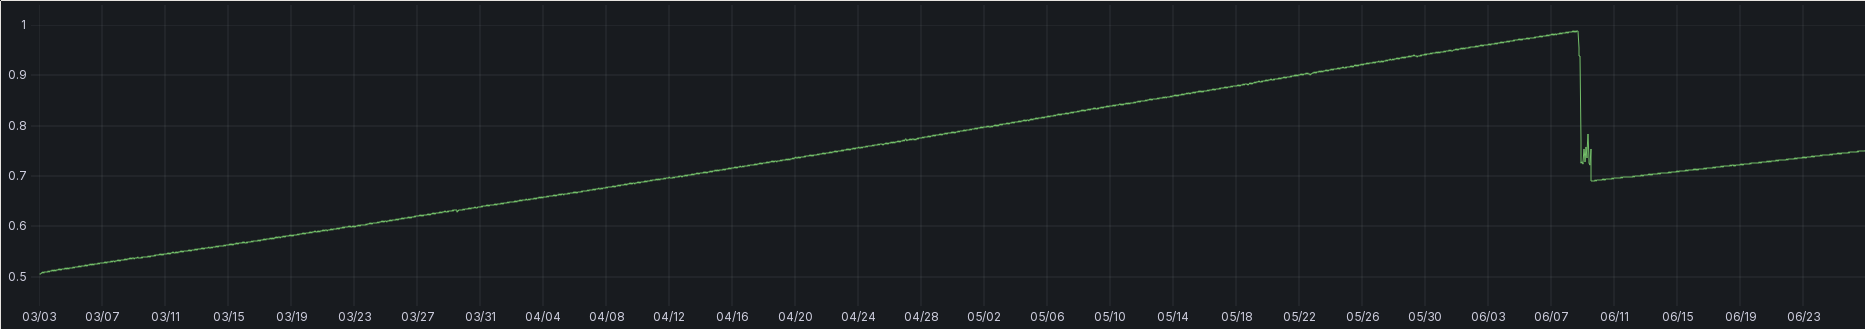
All the above being said, the entire action was not really much of a success. The percentage disk utilization plot I showed in the beginning looks rather impressive, dropping the disk utilization by about 30%. But quite frankly: That’s mostly due to the 20 GB increase in the volume size. Not because of my cleanup. A more realistic picture can be seen here, which is the bytes used of the Prometheus volume up to today:
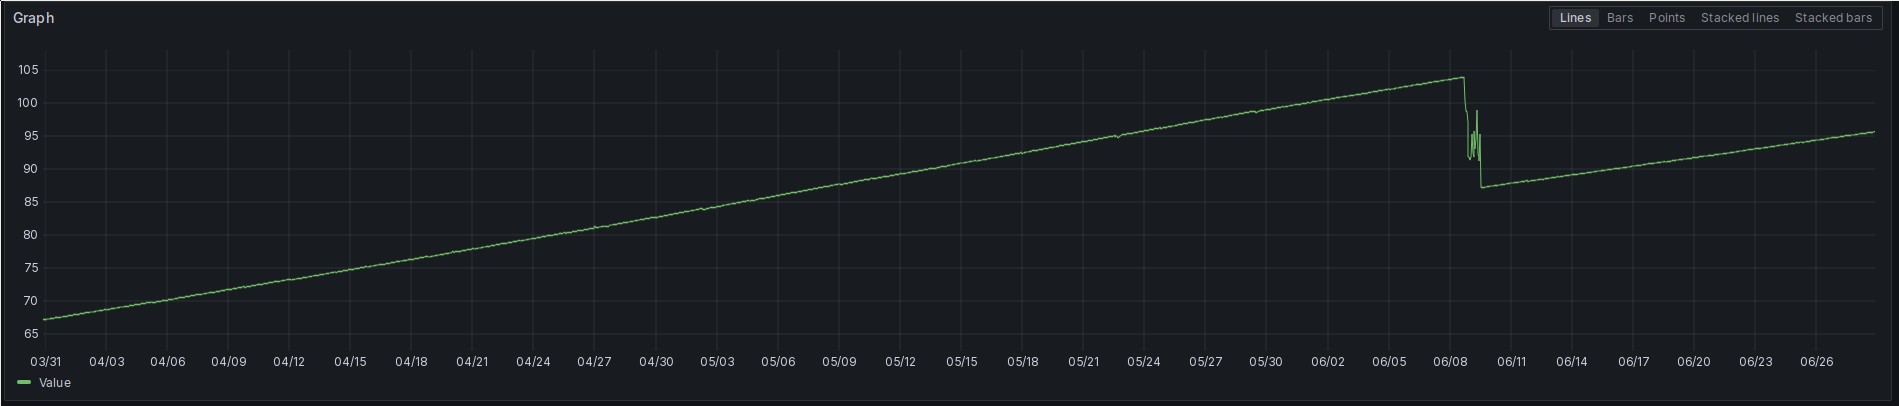
Used bytes on the Prometheus volume in GiB.
This rate of growth isn’t really sustainable in the current setup. I will constantly run out of space on the volume. I could of course radically cut down on the retention period or on the metrics scraped, but I really don’t want to.
So in the near future, I will have to have a look at Thanos. It is already supported in kube-prometheus-stack, and it can provide long term storage in S3, which I prefer over disk volumes.
But that project has to wait until the k8s migration is done. I hope that I won’t have to repeat this action until that’s completed.