
Wherein I set up Prometheus for metrics gathering in the k8s cluster.
This is part 10 of my k8s migration series.
Let me tell you something about me: I love metrics. And pretty charts. The more the better. Back in 2020, setting up Prometheus+Grafana was what brought me to Homelabbing as a hobby, instead of just a means to an end, running some services I wanted to use. I had just gotten an updated ISP connection and found my old FritzBox not working anymore. Instead of just buying a newer one, I decided to try out OPNsense. This meant that I now had two hosts in the Homelab. My old home server running a handful of services, and the new OPNsense box. And I wanted metrics, especially about CPU and network usage.
Today, my Prometheus database takes about 50 GB on disk and I’ve got a retention period of five years. 😅 It’s not just host metrics anymore. I’m also scraping thermometers and smart plugs to monitor my home a bit.
One of the main things I’m using my monitoring stack for is to analyze changes in the noise level. My desk is right next to my server rack. And sometimes, fans suddenly ramp up, or hard disks start seeking without me doing anything. Then I like the ability to go to my Homelab dashboard and immediately identify which service is likely responsible for that increase in the noise level.
In this post, I will go over the migration of my Prometheus setup to k8s. I will also migrate Grafana, but to keep the post relatively short, I decided to split the Prometheus and Grafana posts instead of handling the entire monitoring migration in one go.
Setup
For the monitoring deployment, I decided to use kube-prometheus-stack, which I was pointed to by multiple Homelabbers on the Fediverse while working on my first test cluster. It is a Helm chart which is able to deploy a full monitoring stack for k8s and contains multiple components.
The first component deployed is an instance of prometheus-operator. This operator’s main task is to deploy one (or several) Prometheus instances. It also supplies a number of CRDs to configure scraping for those Prometheus instances with Kubernetes manifests, instead of manipulating the Prometheus config file directly. The two main CRDs are ServiceMonitors and ScrapeConfigs. The ServiceMonitor especially is something which seems to be accepted more widely for configuring service scraping. I’ve already seen the ability to create ServiceMonitors in several Helm Charts I have deployed, e.g. Ceph Rook’s. This way, you don’t have to create scrape configs manually.
The next component deployed by the Helm chart is kube-state-metrics. This is a component which scrapes the Kubernetes apiserver and supplies a lot of additional information about the state of the cluster, for example detailed info about Pods or Deployments.
Finally, the Helm chart can also deploy and properly configure Grafana, and comes with a number of pre-defined dashboards for the data scraped from the cluster. I will skip this component for now and take it up in the next post in this series, when I’m migrating my Grafana instance.
Before going on to the values.yaml, I also need to talk about the necessary
config for Kubernetes components. By default, most components in a kubeadm
cluster only listen on local ports. Most component’s metrics were not too
interesting, with the Kube Scheduler as an exception. To make it available
for Prometheus scraping, I added the following to my ClusterConfiguration:
scheduler:
  extraArgs:
    bind-address: 0.0.0.0
I disabled the scraping for the Kube Controller Manager completely, because the metrics from it didn’t look interesting enough to bother changing the config after I had already set up the cluster.
Here is the full values.yaml file for the kube-prometheus-stack chart:
crds:
  enabled: true
commonLabels:
  homelab/part-of: monitoring
defaultRules:
  create: false
windowsMonitoring:
  enabled: false
alertmanager:
  enabled: false
grafana:
  enabled: false
kubeProxy:
  enabled: false
kubeEtcd:
  enabled: false
kubeControllerManager:
  enabled: false
nodeExporter:
  enabled: false
prometheusOperator:
  networkPolicy:
    enabled: true
    flavor: cilium
  logFormat: json
prometheus:
  networkPolicy:
    enabled: true
    flavor: cilium
    cilium: {}
  ingress:
    enabled: true
    annotations:
      traefik.ingress.kubernetes.io/router.entrypoints: secureweb
    hosts:
      - prometheus.example.com
  serviceMonitor:
    selfMonitor: false
  prometheusSpec:
    scrapeInterval: 30s
    retention: 5y
    replicas: 1
    logLevel: debug
    logFormat: json
    scrapeConfigSelectorNilUsesHelmValues: false
    resources:
      requests:
        cpu: 150m
        memory: 700Mi
      limits:
        memory: 900Mi
    storageSpec:
      volumeClaimTemplate:
        spec:
          storageClassName: rbd-bulk
          accessModes: ["ReadWriteOnce"]
          resources:
            requests:
              storage: 100Gi
The first thing to note here is that I’m disabling a lot of functionality. The first one is all alerting features. I don’t have alerting set up on my Nomad cluster either, but I’ve had in on my list for a long time. I will get to it at some point. 🙂
Next is that I’m keeping Grafana disabled as well. For now I will use my Nomad Grafana instance. The migration of Grafana will come in the next step.
Then I’m disabling scraping of the Kubernetes proxy, because I’ve got that component disabled, using Cilium instead. Further, I’ve got etcd and the Kube Controller Manager also disabled, because I did not see anything interesting in their metrics. Finally, the node-exporter functionality of the chart is also disabled, because I’m already deploying it via Ansible on all of my nodes. And because I’ve got nodes, like my OPNsense box, which don’t run Kubernetes, I decided to keep the node-exporter config in Ansible, on the node level. This is better, having a common config for all hosts in the Homelab, instead of having some hosts configured via Ansible and some via this Helm chart.
I’ve currently got an Ingress configured for Prometheus. This is only temporary, while I’m still using the Grafana deployment on Nomad. After that’s migrated to Kubernetes as well, there will no longer be any need for it.
One important thing to point out is the prometheus.prometheusSpec.scrapeConfigSelectorNilUsesHelmValues
option. With this option unset, the Prometheus operator will only look at
ScrapeConfig resources deployed by the Helm chart itself. But I wanted to create
the files separately (see next section).
Finally, I would like to leave a couple of lines here about the data migration. As I noted above, I like pretty charts. And I like to have access to older data as well, which is why I’ve got a retention period of five years for Prometheus. I was a bit apprehensive about how well the migration would go. But it turns out that Prometheus is absolutely fine when just copying over the files from another Prometheus instance.
I just copied the data files from my old Prometheus volume over to the new one
with a rsync -avP /mnt/old-volume/* /mnt/new-volume/prometheus-db/. The
permissions/ownership of the files doesn’t seem to matter much, the new
Prometheus instance was fine with handling the old ownership of the files upon
restart.
Scraping
And now onto the scrape configs. In good Kubernetes style, you don’t just create a Prometheus config file. Instead, scrapes are configured via ServiceMonitors and ScrapeConfigs. I won’t go into detail on the ServiceMonitor here, as I don’t directly use any of it yet - it is only used behind the scenes to configure scraping for the Kubernetes components.
But I did need to introduce some ScrapeConfigs to configure the k8s Prometheus instance so that it would scrape all the targets the old instance was scraping.
As an example of what this looks like, here is a ScrapeConfig for the node-exporter running on all of my hosts:
apiVersion: monitoring.coreos.com/v1alpha1
kind: ScrapeConfig
metadata:
  name: scraping-hosts
  labels:
    prometheus: scrape-hosts
spec:
  staticConfigs:
    - labels:
        job: hostmetrics
      targets:
        - "my.host:9100"
  relabelings:
    - sourceLabels:
        - "__address__"
      regex: '([^\:]+)\:[0-9]+'
      targetLabel: instance
  metricRelabelings:
    - sourceLabels:
        - "__name__"
      action: drop
      regex: go_.*
The config under spec: is very similar to what would be put into the
Prometheus config in a baremetal deployment. The same config would look something
like this:
scrape_configs:
  - job_name: hostmetrics
    static_configs:
      - targets:
          - "my.host:9100"
    relabel_configs:
      - source_labels: [__address__]
        regex: ([^\:]+)\:[0-9]+
        target_label: instance
    metric_relabel_configs:
      - source_labels: [__name__]
        action: drop
        regex: go_.*
On the one hand this similarity is pretty nice. But on the other hand, the differences, especially the switch from snake_case to camelCase, threw me off several times.
Here is a more involved example with more configs, for my snmp-exporter, which uses SNMP to gather metrics from my VDSL modem:
apiVersion: monitoring.coreos.com/v1alpha1
kind: ScrapeConfig
metadata:
  name: scraping-modem
  labels:
    prometheus: scrape-modems
spec:
  staticConfigs:
    - labels:
        job: modemmetrics
      targets:
        - 300.300.300.1
  metricsPath: /snmp
  scrapeInterval: 1m
  params:
    module:
      - routernameHere
  relabelings:
    - sourceLabels:
        - "__address__"
      targetLabel: __param_target
    - targetLabel: instance
      replacement: routerHostnameHere
    - targetLabel: __address__
      replacement: snmp-exporter.example.com
  metricRelabelings:
    - sourceLabels:
        - "__name__"
      action: drop
      regex: snmp_scrape_.*
    - sourceLabels:
        - "__name__"
      action: drop
      regex: sysName
    - sourceLabels:
        - "adslAturCurrStatus"
      regex: ([A-Z]*).*
      targetLabel: adslAturCurrStatus
      replacement: ${1}
This is just to demonstrate that the ScrapeConfig supports most of the options which are supported in the Prometheus config file. In the operator docs, they’re hedging their bets a bit claiming that “most” configs are supported, but in my relatively large scrape configs I didn’t find a single case of an option which wasn’t supported in ScrapeConfig.
One somewhat interesting case I would like to bring up was the scrape config for Uptime Kuma. This had the special requirement of basic auth credentials for the scrape. My config looks like this:
apiVersion: monitoring.coreos.com/v1alpha1
kind: ScrapeConfig
metadata:
  name: scraping-kuma
  labels:
    prometheus: scrape-kuma
spec:
  staticConfigs:
    - labels:
        job: uptime
      targets:
        - "kuma.example.com"
  scheme: HTTPS
  basicAuth:
    password:
      key: password
      name: kuma-basic-auth
    username:
      key: username
      name: kuma-basic-auth
Here is where I found a difference between the Prometheus config file and the
ScrapeConfig. In my previous prometheus.yaml, I had the following:
  - job_name: 'uptime'
    scrape_interval: 30s
    scheme: https
    static_configs:
      - targets: ['kuma.example.com']
    basic_auth:
      password: {{ with secret "mysecret/foo/kuma" }}{{ .Data.secret }}{{end}}
This file would be templated in Nomad with the mysecret/foo/kuma secret
from Vault. Note that I’m not giving a username here. Kuma simply ignores
the username in the BasicAuth.
But in the Secret I prepared for the k8s Prometheus, kuma-basic-auth, I had
to add a data.username field, as this field is required, and the admission
webhook of the Prometheus operator would throw an error if it is not supplied.
So now I’ve got the username foo in the Secret to work around this issue.
Besides the Uptime Kuma config issue, the migration went very nice and smoothly. Biggest issue was when I was done copying the old Prometheus data and then accidentally deleted the volume I had just copied that data to, instead of the old volume. 🤦
The k8s dashboard
Now onto the result of all this data gathering. 🤓
The first thing I would like to ask, if you’re also using Prometheus data scraping for your Kubernetes cluster: How do you identify “problematic” Pods? E.g. Pods which are in a CrashLoop, or which are just pending because there’s no space left? I didn’t really find anything good, and my googling skills deserted me. If you’ve got a couple good stats, hit me up on the Fediverse, please!
Okay, first two plots are overall resource utilization in the cluster:
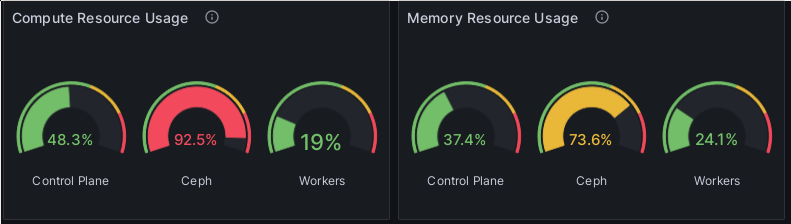
My resource utilization panels.
This shows the three groups of hosts in my cluster, which are separated by different taints. The control plane are the three control plane nodes, 4 cores and 4 GB of RAM each, simulating the three Raspberry Pi 4 4GB which will ultimately house the control plane. Ceph is currently two machines hosting the OSDs for the storage and some other Ceph pieces. They’re so full because Ceph needs a lot of pods for basic functionality, and I gave them all an affinity for the Ceph hosts. The workers are currently two VMs and a lone Raspberry Pi CM4 8GB. As you can see from the utilization, most of what’s running on the k8s cluster at the moment is still infrastructure.
These two panels were not as easy to create as I had thought. I just couldn’t get the values to line up with the results of kube-capacity.
But before I get too far into the weeds, let’s have a look at the PromQL query for the CPU utilization panel. The memory panel is almost exactly the same:
(sum(kube_pod_container_resource_requests{resource="cpu"} and on(pod) (kube_pod_status_phase{phase="Running"} == 1) and on(node) (kube_node_spec_taint{value!="ceph"}))) / sum((kube_node_status_capacity{resource="cpu"} and on(node)kube_node_spec_taint{value!="ceph"}))


(sum(kube_pod_container_resource_requests{resource="cpu"} and on(pod) (kube_pod_status_phase{phase="Running"} == 1) and on(node) (kube_node_spec_taint{value="ceph"}))) / sum((kube_node_status_capacity{resource="cpu"} and on(node)kube_node_spec_taint{value="ceph"}))


(sum(kube_pod_container_resource_requests{resource="cpu"} and on(pod) (kube_pod_status_phase{phase="Running"} == 1) unless on(node) (kube_node_spec_taint{}))) / sum((kube_node_status_capacity{resource="cpu"} unless on(node) kube_node_spec_taint{}))
(One of those things which just make me quietly happy: Hugo’s syntax highlighter supports PromQL. 🙂)
Each of these has a numerator, which is the sum of the requests of all of the pods running on the given group of hosts. The denominator then is the total resources available to the given host group. This had some complexity.
Let’s just start with the very first part, which is similar for all of the host groups:
sum(kube_pod_container_resource_requests{resource="cpu"} and on(pod) (kube_pod_status_phase{phase="Running"} == 1)
This part contains the base metric, kube_pod_container_resource_requests.
This metric reflects the resources requested by each container in each pod.
The first thing I found was that these were of course not just all currently
running pods, but really all pods. So the first thing to do was a “filter” on
the containers. This is what the second part does:
and on(pod) (kube_pod_status_phase{phase="Running"} == 1)
Let’s start with this one at the back: The kube_pod_status_phase is a really
useful metric when you want to find things out about pods. In this case, I
wanted to get all Running pods. But it’s not enough to just get all the
Pods with Running phase. That would be too many, including pods which are
already gone, for some reason. But checking whether the actual value of the
metric equals 1 does the trick.
So what now happens: With the and as an operator, Prometheus outputs a new
vector which contains all the labels of kube_pod_container_resource_requests.
Then it filters out all values from that vector where no entry in the
kube_pod_status_phase{phase="Running"} == 1 vector has the same value for the
pod label. In short, the result of this entire first part are the resource
requests for all containers on the entire cluster which are currently running.
But this wasn’t exactly what I wanted. I need to know whether any of my groups of hosts is getting full. Which leads me to the second part of the numerator. This provides the filter for a specific group of hosts. The first two filter for the two groups of hosts which have a taint, the control plane and Ceph nodes:
and on(node) (kube_node_spec_taint{value!="ceph"})
and on(node) (kube_node_spec_taint{value="ceph"})
The third one filters for my worker nodes, which don’t have a taint:
unless on(node) (kube_node_spec_taint{})
Here I’m constructing a vector of all nodes with taints and then filter the Kubernetes pod requests for all elements which are not in that vector.
And with that, I’ve finally got three sets of resource requests, one for each group of hosts.
The denominator then has to be the total resources of the three node groups.
This works the same as the nominator query. Here, the data I want is in the
kube_node_status_capacity{resource="cpu"} metric, and I again filter by
the taint to get the total resources per group.
Before moving on to the next chart, it’s important to note that the kube_pod_container_resource_requests
metric is not 100% accurate. For most of my nodes, summing up all of the
requests results in a slightly too low value, when compared to the output of
kube-capacity. This happens because requests can be put on the container and on
the Pod. One example in my cluster are the Cilium Pods. Going by my Prometheus
metrics, they don’t have any CPU requests. But in reality, they do request
50m CPUs, just on the Pod, not the container.
There is a better metric for this, discussed in this GitHub issue.
This metric, kube_pod_resource_requests, is more precise. But it is not enabled
by default. See also the Kubernetes docs.
I will likely enable this one later, but did not bother now.
So now onto the next set of metrics, which are the per-container metrics. The first one is the CPU usage:
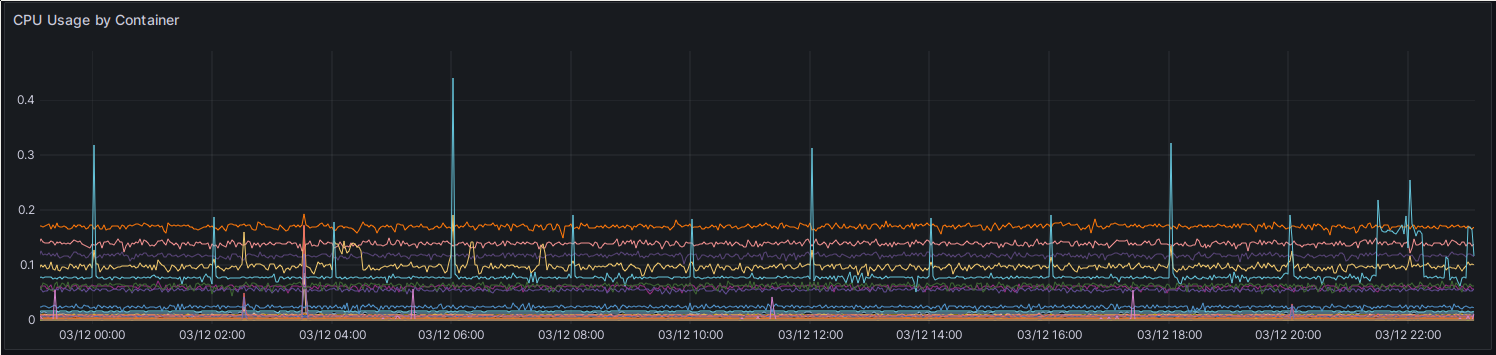
My CPU utilization, in total CPU usage seconds.
I’ve got two of these, both using the container_cpu_usage_seconds_total metric.
One of them is aggregated per container, and one per Namespace. I did not go
with aggregation by Pod, because the pod names are not stable.
The query for this plot is pretty simple:
sum(rate(container_cpu_usage_seconds_total{container!~"POD|"}[$__rate_interval])) by (container)
The only “special” thing I needed to do here was to exclude the POD “container”
and the container with the empty name. The value with the POD container is
actually the “Pause” container of the Pod, while the empty container is the value
for the cgroup, and I’m interested in neither.
This plot shows one of those small, yet interesting things which make me look at my metrics:
CPU usage of Prometheus after a redeployment.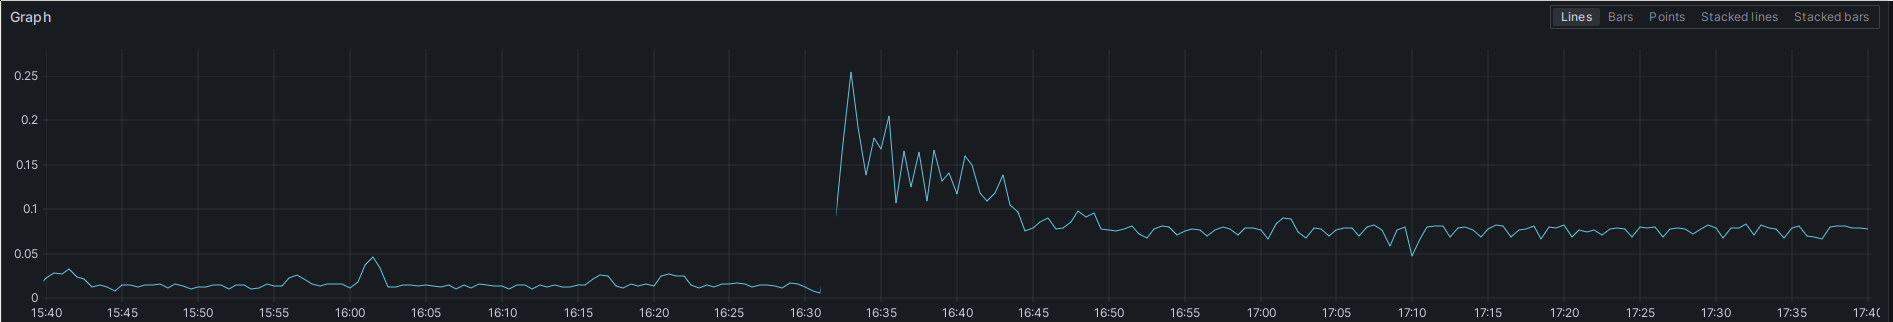
Let’s finish by looking at the values for the CPU usage again. It reflects the current state of the cluster pretty well - there’s not that much running on it yet. The majority of my workloads are still running on my Nomad/Baremetal Ceph cluster. The three top users by container are the cilium-agent, kube-apiserver and etcd. Even the Ceph OSDs come only after that. This will change in the future of course, e.g. the OSDs will become more loaded once the root disks of my worker nodes start running off of the Ceph Rook cluster. But for now, it’s mostly just the infrastructure.
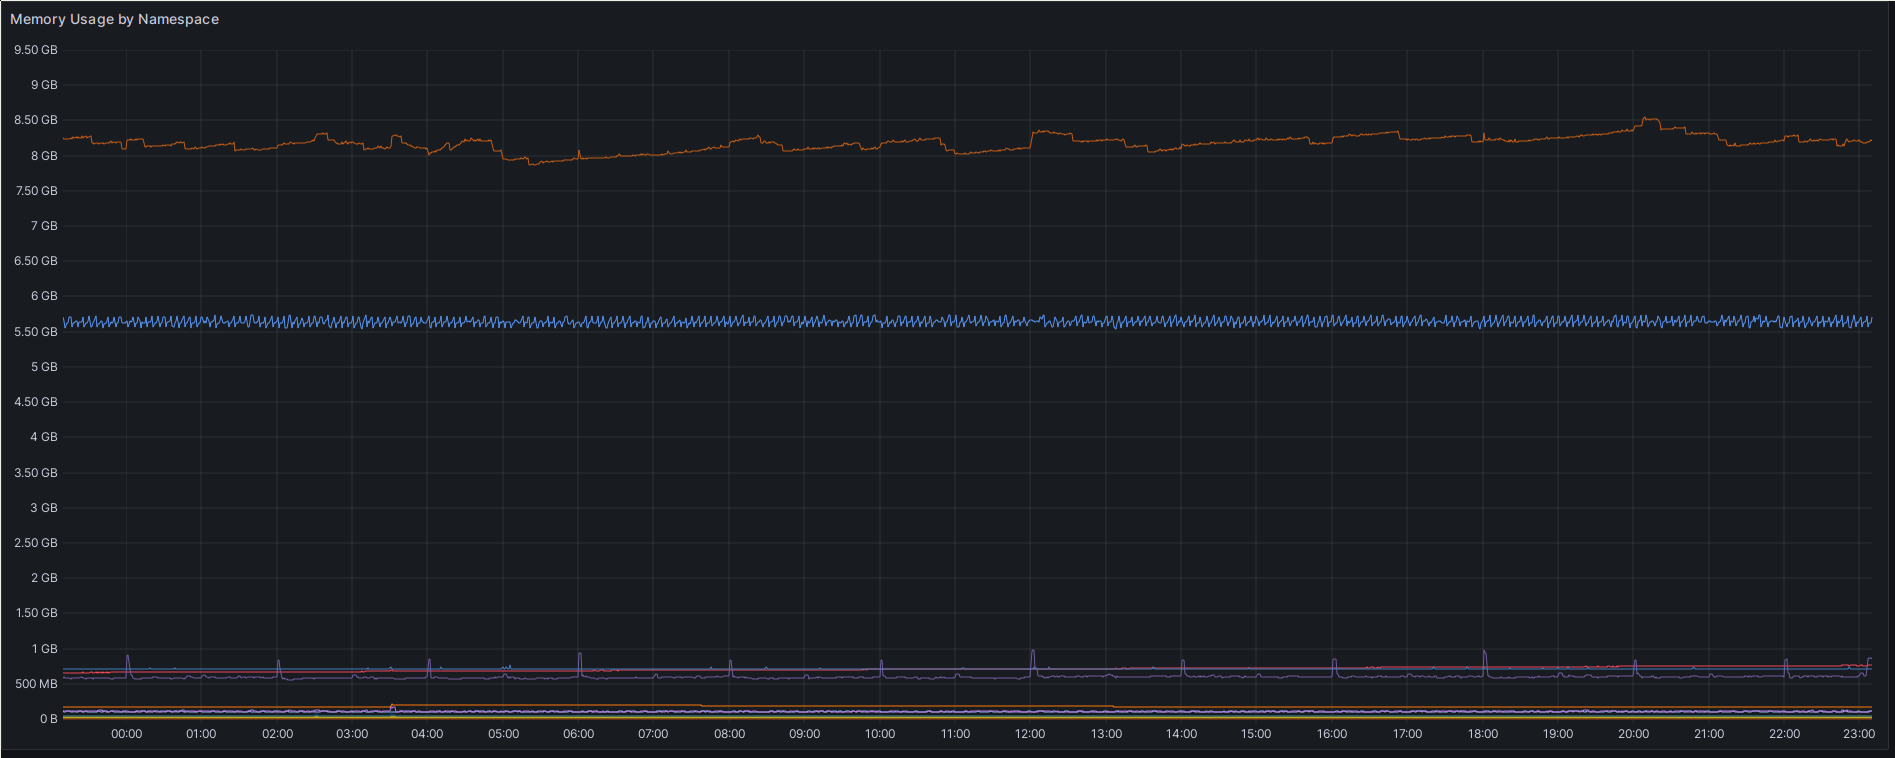
Memory usage by Namespace.
The memory usage shows a similar pattern, although here, the top curve, around
8.3 GB, is the rook-cluster namespace, housing all the main Ceph components.
The next lower curve, around 5.5 GB is the kube-system namespace, again showing
that for now, infrastructure dominates my cluster’s memory consumption.
Memory usage, overall, is not an easy thing to measure in Linux. I’ve found this article quite useful. cAdvisor, which provides the per-container metrics, has several choices for memory usage:
container_memory_rsscontainer_memory_usage_bytescontainer_memory_working_set_bytes
Here are these three metrics, shown as a sum for my Monitoring namespace, running Prometheus itself and the Prometheus operator as well as kube-state-metrics:
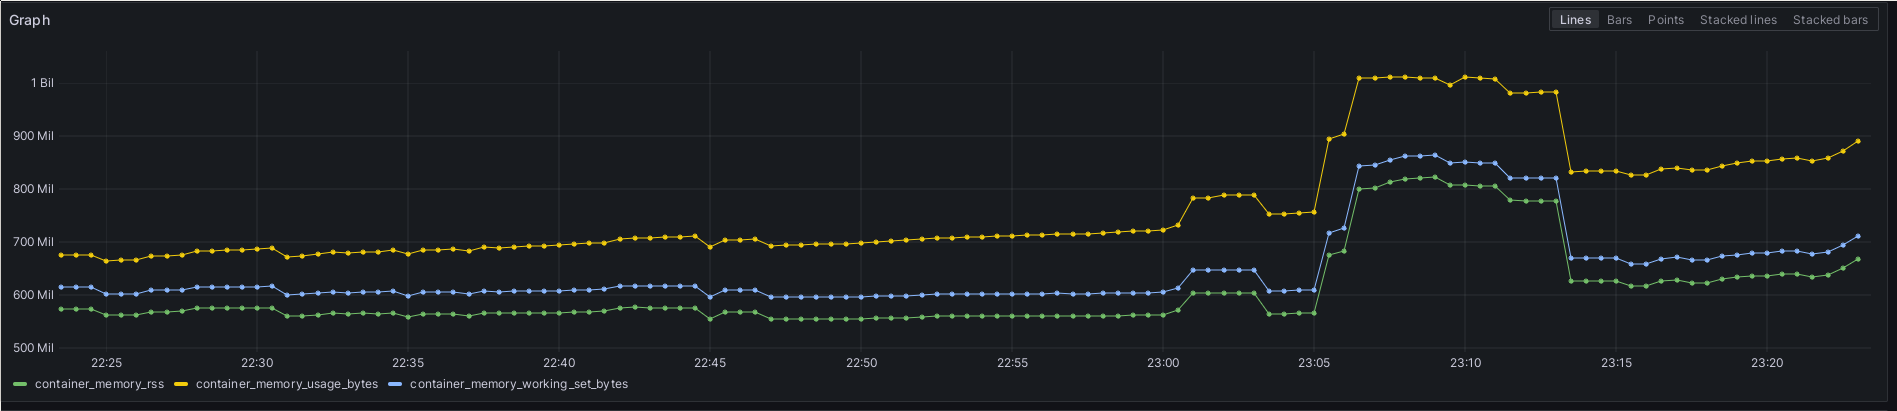
The three types of memory metrics as sums over the monitoring Namespace.
This shows the differences. The Resident Set Size
being heap and stack in memory is the lowest of the three curves. Next, the
Working Set Size is the amount of memory which was recently touched by the
process. It is generally called the data which the process needs in the next couple
of seconds to do its work. I found this post and interesting read. The final and highest curve is the Memory Usage.
This is so high because it also contains files mapped into memory, even when those
files haven’t been touched in a while. No surprise that Prometheus, which is
mostly a time series DB, all said and done, should have a pretty hefty memory
mapping usage for its DB files.
What annoyed me a bit is that none of these values actually corresponds to the
RES values I’m seeing in htop. But the working set came closest, and its
definition made the most sense to me, so I’ve been going with that one for now.
Next up is networking: Network transmissions by namespace over 24h. The spikes are dominated by the rook-cluster namespace, in orange.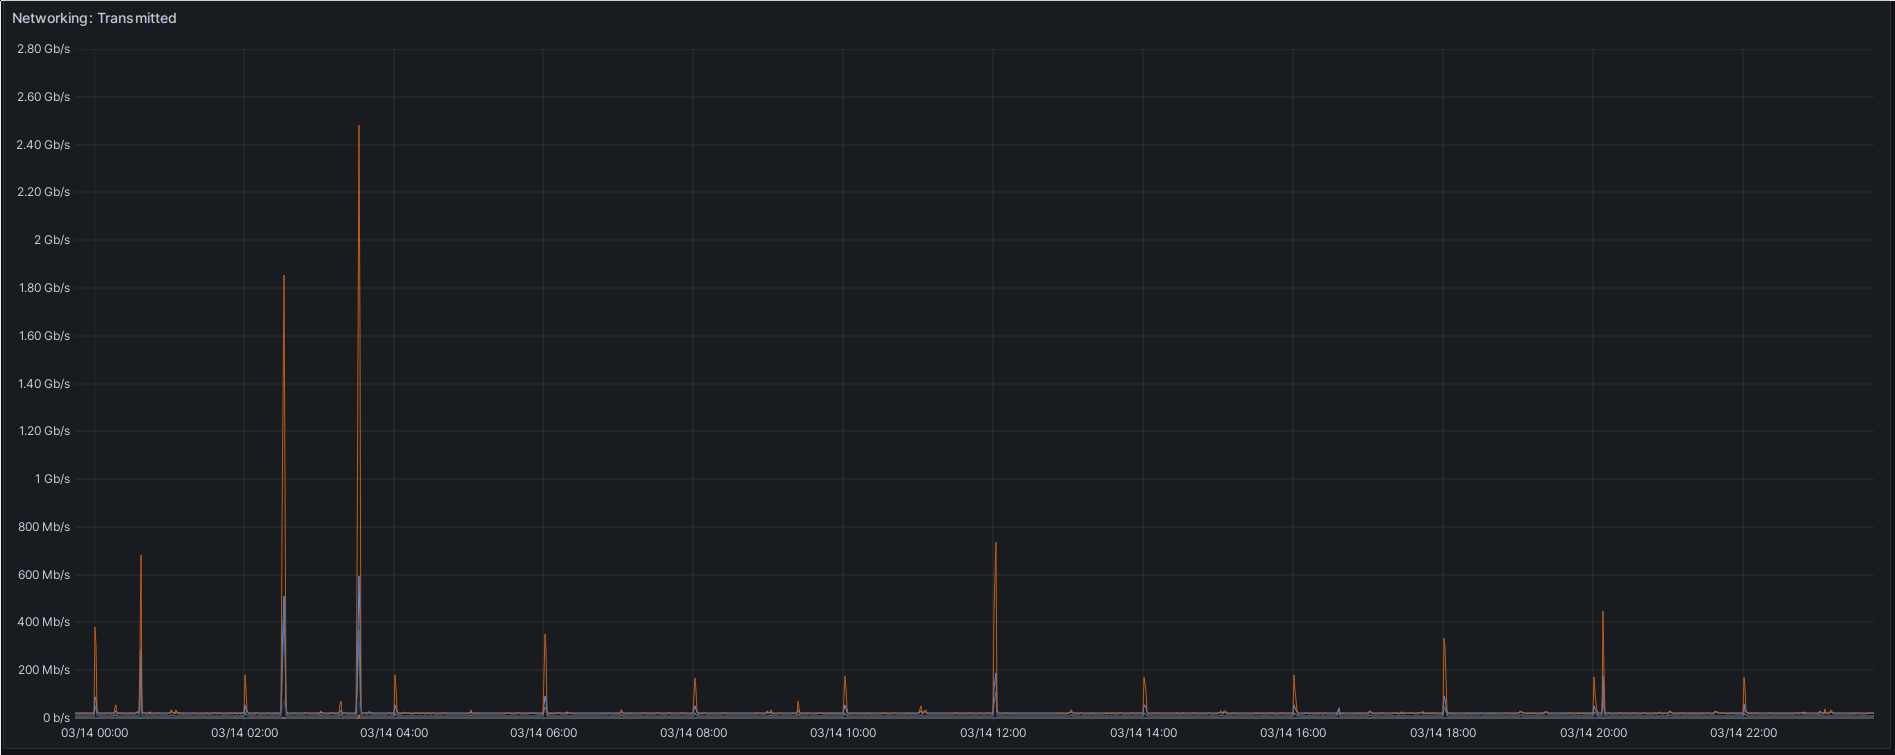
First important thing to note about this chart: It is an aggregation over all Pods in a namespace. And those pods might be running on different hosts. That’s how I’m getting max throughput of 2.48 Gbps, even though I’ve only got a 1 Gbps LAN here. Another thing might be loopback interface traffic, which of course can also be faster. The two spikes at 02:30 and 03:30 are my backups. The first, lower spike up to 1.85 Gbps are my volume updates. The Ceph Rook cluster already hosts the S3 backup buckets, while the baremetal cluster still hosts the CSI volumes. So I expect these spikes to increase in the future, when the Ceph Rook cluster needs to provide both, the data being backed up and the backup target. Then the higher spike at 03:30 is my backup of many of those backup buckets to an external HDD. I’m currently not 100% sure why that one produces more network traffic. What I’m also wondering about right now is what that blue curve, which follows the two spikes but doesn’t go quite as high, is all about. That’s the rook-ceph namespace, which only contains the Rook operator and the CSI plugin pods. None of those should be in the data path during a transmission. Not sure what’s going on here.
Then let me finish with my favorite plot: CSI storage volume utilization.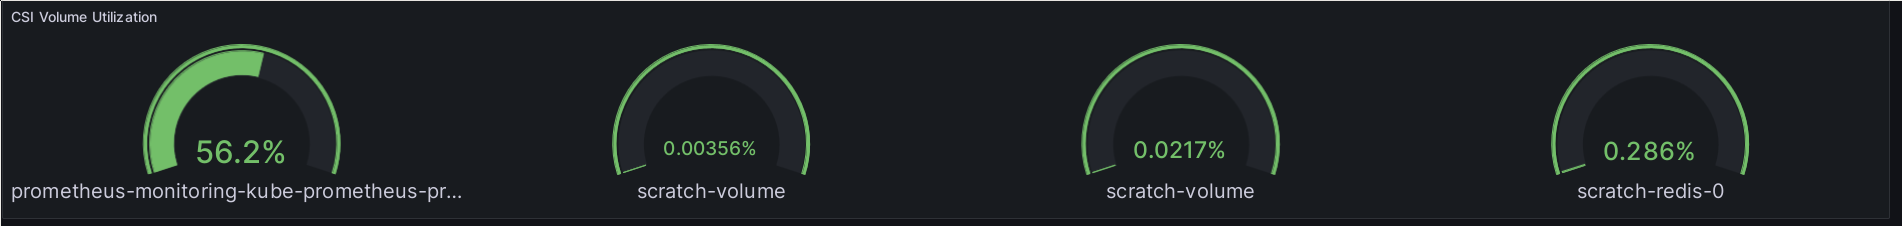
df -h on the nodes and filtered for Nomad’s CSI volume mount
dir to find the right values. Those were then written to a file in Prometheus
format, to be picked up by the local node-exporter’s textfile collector. But
here, I’m getting those directly from Kubernetes, which is pretty nice.
But there’s one disadvantage with this plot: If a volume has been remounted
during the metric interval, it will show up twice, as one of the labels on the
kubelet_volume_stats is the node where the volume was mounted.
And that’s it! 🎉 I’ve finally got metrics for my k8s cluster. Next step will be migrating my Grafana instance to k8s as well.