
I recently started migrating my Grafana instance from Nomad to k8s and hit some very weird errors in the CloudNativePG DB after letting it run for a short while.
This is an addendum to my previous post on CloudNativePG.
The initial issue
The first issue came during the first setup of Grafana. A couple of minutes after Grafana started running and writing data to the DB, the two database pods (primary and replica) suddenly stopped working and just threw this error:
msg="DB not available, will retry"
err="failed to connect to `host=/controller/run user=postgres database=postgres`: dial error (dial unix /controller/run/.s.PGSQL.5432: connect: no such file or directory)"
Initially, I thought I had somehow screwed up my NetworkPolicy setup. But after re-creating the CloudNativePG Cluster CR, it all worked again. I thought it was a hiccup and returned to working on Grafana, but a couple of minutes into the next Grafana deployment, the same issue happened again. And then again, after another deletion and re-creation of the Cluster CR. The error was always the same.
What saved me in the end was a random look at my metrics dashboard, where I’m showing the following plot:
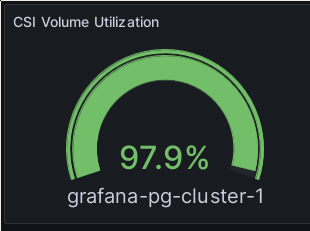
Yupp, it’s full.
So there I had it. I had simply made the volume for the Postgres DB storage too small. Way too small, as it turns out. My Cluster manifest looked like this:
apiVersion: postgresql.cnpg.io/v1
kind: Cluster
metadata:
  name: grafana-pg-cluster
  labels:
    homelab/part-of: grafana
spec:
  instances: 2
  imageName: "ghcr.io/cloudnative-pg/postgresql:16.2-10"
  bootstrap:
    initdb:
      database: grafana
      owner: grafana
  resources:
    requests:
      memory: 100M
      cpu: 100m
  postgresql:
    parameters:
      max_connections: "20"
      shared_buffers: "25MB"
      effective_cache_size: "75MB"
      maintenance_work_mem: "6400kB"
      checkpoint_completion_target: "0.9"
      wal_buffers: "768kB"
      default_statistics_target: "100"
      random_page_cost: "1.1"
      effective_io_concurrency: "300"
      work_mem: "640kB"
      huge_pages: "off"
      max_wal_size: "128MB"
  storage:
    size: 256MB
    storageClass: rbd-fast
While creating this config, I had looked at the size of the Grafana DB on my
Nomad instance, and it clocked in at around 35MB. So I wasn’t really that worried.
But it seems I misunderstood some things. After changing the storage.size option
to 1GB, everything was fine and the DB no longer crashed.
But that wasn’t the end of my confusion when it came to the storage consumption.
Unbounded growth over time?
With the initial issue fixed, I set myself a task to check the disk usage of the DB after a couple of days. This was during a week where I didn’t have much time to spend on the Homelab, so I expected the database size to not change very much.
The result was this, after a week of not touching the Grafana instance, which is the only user of the DB:
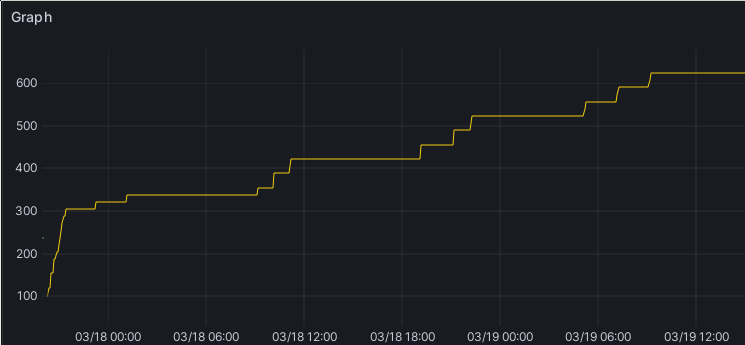
DB disk volume utilization growth.
I couldn’t understand what was going on here. It wasn’t the database itself which was just 12MB in size throughout the entire time. Then I looked at the disk, and saw this:
postgres@grafana-pg-cluster-1:/$ ls -lh /var/lib/postgresql/data/pgdata/pg_wal/
total 561M
-rw------- 1 postgres tape  338 Mar 17 19:13 000000010000000000000003.00000028.backup
-rw------- 1 postgres tape  16M Mar 20 12:09 000000010000000000000036
-rw------- 1 postgres tape  16M Mar 20 12:14 000000010000000000000037
-rw------- 1 postgres tape  16M Mar 20 20:09 000000010000000000000038
-rw------- 1 postgres tape  16M Mar 20 20:14 000000010000000000000039
-rw------- 1 postgres tape  16M Mar 20 21:09 00000001000000000000003A
-rw------- 1 postgres tape  16M Mar 20 21:14 00000001000000000000003B
-rw------- 1 postgres tape  16M Mar 20 22:09 00000001000000000000003C
-rw------- 1 postgres tape  16M Mar 20 22:14 00000001000000000000003D
-rw------- 1 postgres tape  16M Mar 21 06:09 00000001000000000000003E
-rw------- 1 postgres tape  16M Mar 21 06:14 00000001000000000000003F
-rw------- 1 postgres tape  16M Mar 21 08:09 000000010000000000000040
-rw------- 1 postgres tape  16M Mar 21 08:14 000000010000000000000041
-rw------- 1 postgres tape  16M Mar 21 09:09 000000010000000000000042
-rw------- 1 postgres tape  16M Mar 21 16:09 000000010000000000000043
-rw------- 1 postgres tape  16M Mar 21 16:14 000000010000000000000044
-rw------- 1 postgres tape  16M Mar 21 18:09 000000010000000000000045
-rw------- 1 postgres tape  16M Mar 21 18:14 000000010000000000000046
-rw-rw---- 1 postgres tape  16M Mar 21 20:09 000000010000000000000047
-rw-rw---- 1 postgres tape  16M Mar 21 20:14 000000010000000000000048
-rw------- 1 postgres tape  16M Mar 21 21:09 000000010000000000000049
-rw------- 1 postgres tape  16M Mar 21 21:14 00000001000000000000004A
-rw------- 1 postgres tape  16M Mar 22 02:10 00000001000000000000004B
-rw------- 1 postgres tape  16M Mar 22 02:15 00000001000000000000004C
-rw------- 1 postgres tape  16M Mar 22 04:10 00000001000000000000004D
-rw------- 1 postgres tape  16M Mar 22 08:10 00000001000000000000004E
-rw------- 1 postgres tape  16M Mar 22 08:15 00000001000000000000004F
-rw------- 1 postgres tape  16M Mar 22 09:10 000000010000000000000050
-rw------- 1 postgres tape  16M Mar 22 12:10 000000010000000000000051
-rw------- 1 postgres tape  16M Mar 22 12:15 000000010000000000000052
-rw------- 1 postgres tape  16M Mar 22 14:10 000000010000000000000053
-rw------- 1 postgres tape  16M Mar 22 14:15 000000010000000000000054
-rw------- 1 postgres tape  16M Mar 22 19:05 000000010000000000000055
-rw------- 1 postgres tape  16M Mar 22 19:10 000000010000000000000056
-rw------- 1 postgres tape  16M Mar 20 10:09 000000010000000000000057
-rw------- 1 postgres tape  16M Mar 20 10:14 000000010000000000000058
drwxrws--- 2 postgres tape 4.0K Mar 22 19:10 archive_status
That explained at least where the space was going. Then digging a bit into the
Postgres docs, I found the wal_keep_size config option. This option determines how much WAL is kept
around. Looking a bit further, because I certainly hadn’t set that option, I finally
came across CloudNativePG’s default config. And in there, wal_keep_size is set
to 512MB. Which happens to fit the point where the DB volume stopped growing.
See the CloudNativePG docs here.
Still, this seems a bit excessive to me, considering that the database itself is only 12MB. But at least now, I know to add 512MB to the storage volume size to account for Write Ahead Log.
I’m still surprised how much WAL is produced here, even though I’m pretty sure that there isn’t actually that much going on in the database.