
Wherein I document how I migrated my logging setup from Nomad to k8s.
This is part seven of my k8s migration series.
Setup overview
Let’s start with an overview of the setup.
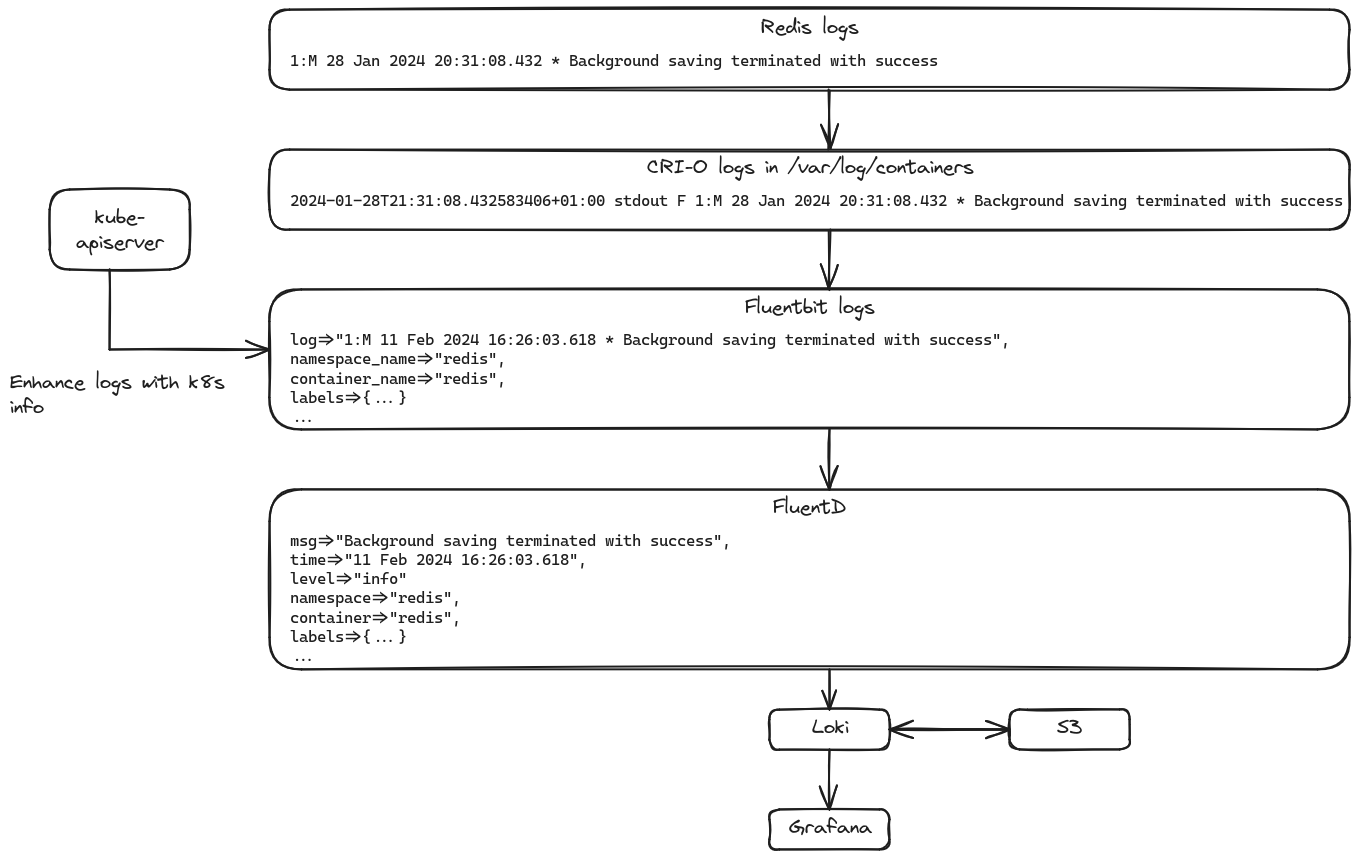
Overview of my logging pipeline.
It all starts out with the app’s logs. Those are output to stdout in the container.
Then, my container runtime, cri-o, takes that and writes
it to files in /var/log/containers/ by default. It also prefixes the log line
with the timestamp, the stream it was coming from, and F for full log lines
as well as P for partial log lines. If I understand correctly, that’s just the
standard log format Kubernetes and/or the CRI spec
expect.
To collect all of these logs, I have a Fluentbit
DaemonSet deployed on all nodes. Mostly, this serves as a pretty dumb log shipper,
tailing all files under /var/log/containers. But before sending the logs
onward, I’m enriching them with some k8s information, like labels, via the
Kubernetes filter.
To gather the logs from all containers in the cluster, as well as the logs from the host’s JournalD instance, I’m using FluentD, where Fluentbit sends the logs via Fluent’s own Forward protocol. Here, the main task is in parsing the log lines themselves, bringing them all into some kind of coherent format. This includes things like bringing all the different ways of defining log levels in line, so I end up only with a few levels.
FluentD then sends those logs to Loki for
long-term storage. There I then access them either via Grafana’s explore
feature when I’m actively looking for something, or via the Log panel: Example of what the final stage of the setup will look like.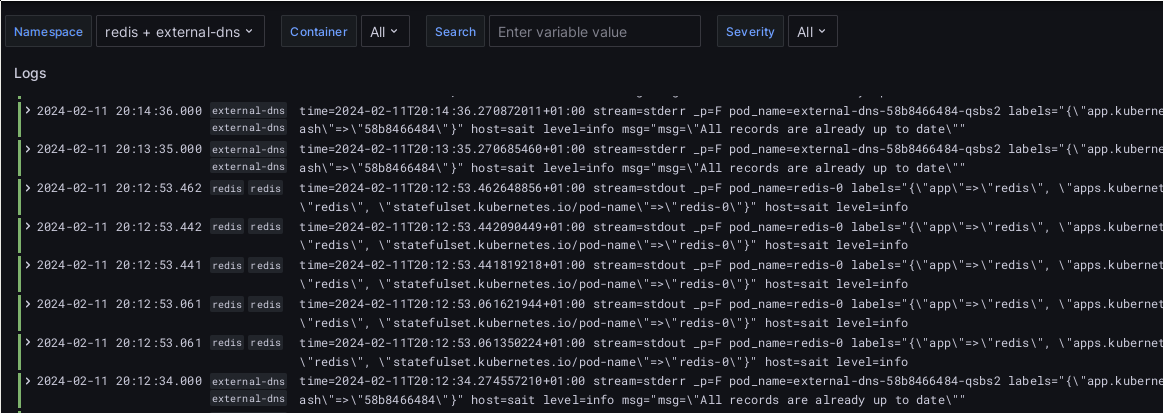
I’ve got separate dashboards for syslogs from the cluster hosts and the running apps.
One question you might ask is: Why not use Fluentbit for host logs as well? The reason, as weird as it might sound, is unification: Not all of my hosts are running, and will ever run, containers. Examples are my OpenWRT WiFi access point and my OPNsense router. They both speak the Syslog protocol, but don’t run containers and aren’t part of the k8s cluster. The same goes for my desktop as well as several other hosts in the Homelab. And I’ve found it to make more sense to standardize on syslog-ng and the syslog protocol than to run Fluentbit everywhere.
Differences to Nomad setup
A short note on the difference to what I had before, in Nomad. The basic setup was the same. With the main difference being that my Nomad cluster runs on Docker, and I’ve been using Docker’s FluentD logging driver. Instead of writing the logs to a file, this driver supports FluentD’s Forward format and can send directly to the Fluentbit instance, without the diversion via a file on disk. In the beginning, I had Nomad/Docker configured in such a way that the first time a log line touched a disk was when it was written to S3 after being delivered to Loki. But this had the downside that when Loki, FluentD, Fluentbit or Grafana were down, I didn’t have a convenient way to get at my logs. So I ended up enabling Nomad’s log writing anyway.
I didn’t follow the same approach for k8s simply because it seemed that k8s
requires the logs on disk anyway, for e.g. kubectl logs access.
Loki setup
So let’s start with the first component. I started at the top of the stack with Loki and worked my way down the stack to Fluentbit mostly because this way, I could first disable the Nomad deployments of Loki and FluentD, instead of reconfiguring the Nomad deployments to also accept logs from k8s just to then switch the deployments off a couple of days later.
For Loki, I wrote my own Helm chart. Loki does provide Helm charts. But they have one glaring downside:
If you set the singleBinary.replicas value to 1, this chart configures Loki to run the all target in a monolithic mode, designed to work with a filesystem storage.
See here. The Helm chart does not allow using any other form of storage, besides the local file system, when using a single binary. And I have absolutely no reason to use the clustered deployment of Loki. But I do want to use S3 for storage, as I find the “just a big lake of data” approach of S3 pretty nice, especially for logs.
To begin with, let’s look at the values file:
commonLabels:
  homelab/part-of: loki
port: 3100
lokiPath: "/hl-loki"
I’ve kept this pretty simple, as it’s my own chart, I’m only using Helm values
for things which I need to reference in multiple different manifests. So this
only contains the port Loki will listen on, my common homelab/part-of label
and the path where some scratch storage will be mounted as a working directory.
Instead of starting with the deployment and going from there, I will start with all the manifests used in there this time. Let’s see whether that improves the reading flow.
First, the S3 bucket. This bucket will be used as storage for the logs and the index. I will create it with Ceph Rook’s Object Bucket Claim:
apiVersion: objectbucket.io/v1alpha1
kind: ObjectBucketClaim
metadata:
  name: logs
spec:
  generateBucketName: logs
  storageClassName: rgw-bulk
This claim will create a bucket in Ceph’s RGW S3 implementation and will
generate a set of credentials to access that bucket, in the form of both a
Secret and a ConfigMap. The bucket’s name is partially randomly generated, and
in my case, the bucket is called logs-4138cb40-b96c-4526-b47e-f474a4978775.
The secret will be named after the generateBucketName, so in this case it
will just be called logs. It contains the values AWS_ACCESS_KEY_ID and
AWS_SECRET_ACCESS_KEY. This way, when used via the fromEnv functionality
in a Pod spec, it automatically exposes the S3 credentials in the standard ENV
variables.
The ConfigMap generated by the OBC is also called logs. It contains the necessary
config values to configure an application to access the bucket:
apiVersion: v1
data:
  BUCKET_HOST: rgw-service.ceph-cluster-namespace.svc
  BUCKET_NAME: logs-4138cb40-b96c-4526-b47e-f474a4978775
  BUCKET_PORT: "80"
  BUCKET_REGION: ""
  BUCKET_SUBREGION: ""
kind: ConfigMap
This configuration is then used via environment variables, which are accessed in the Loki configuration file, which I provide via a ConfigMap:
apiVersion: v1
kind: ConfigMap
metadata:
  name: loki-conf
  labels:
    {{- range $label, $value := .Values.commonLabels }}
    {{ $label }}: {{ $value | quote }}
    {{- end }}
data:
  loki.yaml: |
    target: "all"
    auth_enabled: false
    server:
      http_listen_port: {{ .Values.port }}
      grpc_server_max_recv_msg_size: 8000000
      log_format: "json"
    common:
      path_prefix: {{ .Values.lokiPath }}
      instance_addr: 127.0.0.1
      storage:
        s3:
          s3forcepathstyle: true
          bucketnames: ${BUCKET_NAME}
          endpoint: ${BUCKET_HOST}:${BUCKET_PORT}
          access_key_id: "${AWS_ACCESS_KEY_ID}"
          secret_access_key: "${AWS_SECRET_ACCESS_KEY}"
          insecure: true
      ring:
        kvstore:
          store: "inmemory"
    query_range:
      cache_results: true
      results_cache:
        cache:
          redis:
            endpoint: redis.redis.svc.cluster.local:6379
          embedded_cache:
            enabled: false
    ingester:
      wal:
        enabled: false
      lifecycler:
        ring:
          replication_factor: 1
          kvstore:
            store: "inmemory"
    storage_config:
      boltdb_shipper:
        active_index_directory: {{ .Values.lokiPath }}/active_index
        shared_store: "s3"
        cache_location: {{ .Values.lokiPath }}/shipper_cache
    chunk_store_config:
      chunk_cache_config:
        redis:
          endpoint: redis.redis.svc.cluster.local:6379
    schema_config:
      configs:
        - from: 2024-01-01
          store: boltdb-shipper
          object_store: s3
          schema: v12
          index:
            prefix: index_
            period: 24h
    compactor:
      working_directory: {{ .Values.lokiPath }}/compactor/
      shared_store: s3
      retention_enabled: true
    limits_config:
      reject_old_samples: false
      max_entries_limit_per_query: 10000
      deletion_mode: "filter-and-delete"
      retention_period: 1y
Note that the ${ENV_VAR_NAME} syntax is a feature of Loki when reading the
configuration file, it doesn’t have anything to do with k8s directly.
I will show the CLI option which needs to be handed to Loki later.
I kept this config relatively simple. The common: config defines a couple
of shared components, most importantly the S3 storage. Further, I’m also
configuring Redis for caching.
Last, before coming to the Deployment, here’s the scratch volume, on my Ceph SSD pool:
apiVersion: v1
kind: PersistentVolumeClaim
metadata:
  name: scratch-volume
  labels:
    {{- range $label, $value := .Values.commonLabels }}
    {{ $label }}: {{ $value | quote }}
    {{- end }}
spec:
  storageClassName: rbd-fast
  accessModes:
    - ReadWriteOnce
  resources:
    requests:
      storage: 2Gi
This is merely a small workspace for Loki. As long as it gets enough time during shutdown, it will upload all relevant data to S3.
And now, the Deployment:
apiVersion: apps/v1
kind: Deployment
metadata:
  name: loki
  labels:
    {{- range $label, $value := .Values.commonLabels }}
    {{ $label }}: {{ $value | quote }}
    {{- end }}
spec:
  replicas: 1
  selector:
    matchLabels:
      app: loki
      {{- range $label, $value := .Values.commonLabels }}
      {{ $label }}: {{ $value | quote }}
      {{- end }}
  strategy:
    type: "Recreate"
  template:
    metadata:
      labels:
        app: loki
        {{- range $label, $value := .Values.commonLabels }}
        {{ $label }}: {{ $value | quote }}
        {{- end }}
      annotations:
        checksum/config: {{ include (print $.Template.BasePath "/config.yaml") . | sha256sum }}
    automountServiceAccountToken: false
    spec:
      securityContext:
        fsGroup: 1000
      containers:
        - name: loki
          image: grafana/loki:{{ .Values.appVersion }}
          args:
            - "-config.expand-env=true"
            - "-config.file={{ .Values.lokiPath }}/conf/loki.yaml"
          envFrom:
            - configMapRef:
                name: logs
            - secretRef:
                name: logs
          volumeMounts:
            - name: scratch
              mountPath: {{ .Values.lokiPath }}
            - name: config
              mountPath: {{ .Values.lokiPath }}/conf/
              readOnly: true
          resources:
            requests:
              cpu: 100m
              memory: 400Mi
          livenessProbe:
            httpGet:
              port: {{ .Values.port }}
              path: "/ready"
            initialDelaySeconds: 15
            periodSeconds: 30
          ports:
            - name: loki-http
              containerPort: {{ .Values.port }}
              protocol: TCP
      volumes:
        - name: scratch
          persistentVolumeClaim:
            claimName: scratch-volume
        - name: config
          configMap:
            name: loki-conf
The first config to look at is the Recretate update policy, which is needed
because I’m mounting a PVC. With the default Rolling update strategy, the
fresh Pods won’t be able to start, because the volume will still be mounted
by the old Pod.
I’m also applying an interesting strategy in the Pod’s annotations:
annotations:
  checksum/config: {{ include (print $.Template.BasePath "/config.yaml") . | sha256sum }}
This takes the ConfigMap I showed before, templates it, and then takes the Hash of the resulting string. As annotations cannot be changed on a running pod, in contrast to labels, k8s will recreate the pod when that hash changes. This way, the Pod is automatically recreated when the Loki config changes.
I also mentioned above that a CLI flag needs to be set to have Loki insert
environment variables into the configuration file. This is the -config.expand-env=true
flag.
Finally, I’d like to point out the securityContext.fsGroup setting. I did not
have this setting in the beginning, which had the consequence that Loki threw
Permission denied errors when trying to create a couple of directories during
startup. This configuration is always required when mounting PVCs, at least
Ceph PVCs.
I also had to setup a Service and an Ingress, as my Nomad Grafana instance will need to access Loki until I’ve moved it over to k8s as well. I only show the manifests here for completeness’ sake:
apiVersion: v1
kind: Service
metadata:
  name: loki
  labels:
    {{- range $label, $value := .Values.commonLabels }}
    {{ $label }}: {{ $value | quote }}
    {{- end }}
spec:
  type: ClusterIP
  selector:
    {{- range $label, $value := .Values.commonLabels }}
    {{ $label }}: {{ $value | quote }}
    {{- end }}
    app: loki
  ports:
    - name: loki-http
      port: {{ .Values.port }}
      targetPort: loki-http
      protocol: TCP
---
apiVersion: traefik.io/v1alpha1
kind: IngressRoute
metadata:
  name: loki
  annotations:
    external-dns.alpha.kubernetes.io/hostname: "logs.example.com"
    external-dns.alpha.kubernetes.io/target: "ingress.example.com"
spec:
  entryPoints:
    - secureweb
  routes:
    - kind: Rule
      match: Host(`logs.example.com`)
      services:
        - kind: Service
          name: loki
          namespace: loki
          port: loki-http
          scheme: http
I’ve also configured a CiliumNetworkPolicy for the Namespace, which looks like this:
apiVersion: "cilium.io/v2"
kind: CiliumNetworkPolicy
metadata:
  name: "loki"
  labels:
    {{- range $label, $value := .Values.commonLabels }}
    {{ $label }}: {{ $value | quote }}
    {{- end }}
spec:
  endpointSelector: {}
  ingress:
    - fromEndpoints:
      - {}
      - matchLabels:
          homelab/ingress: "true"
          io.kubernetes.pod.namespace: traefik-ingress
      - matchLabels:
          io.kubernetes.pod.namespace: fluentd
          app: fluentd
This also already contains the config for the later FluentD access.
FluentD setup
Next step down the logging stack is my FluentD instance. I’m using it in the role of a log aggregator. All logs produced in my Homelab ultimately end up here. I’ve kept all per-host log shippers as dumb as possible and do all log massaging and aggregation in FluentD. It has served me well in the past, since the days when I used Influx’ Telegraph, for a short while. It is highly efficient, serving all the syslogs and application logs from my entire setup with 105 MB of memory and 1.7% of the CPU. The only slightly weird thing is the configuration language, which has a decidedly XML character, showing the time it was initially implemented. 😉
I’m running FluentD as a singular instance, made available to my entire Homelab via a LoadBalancer type Service. It has to listen on a number of ports as well, for syslogs in both standard formats (RFC3164 and RFC5424) and TCP and UDP as well as forwarding from the Nomad and k8s cluster.
I’m building my own Helm chart here again. Mostly because the current image used in the official chart does not support all plugins I need and I’m building my own image. I’m currently using the following plugins in my configs:
- fluent-plugin-grafana-loki
- fluent-plugin-record-modifier
- fluent-plugin-multi-format-parser
- fluent-plugin-rewrite-tag-filter
- fluent-plugin-route
- fluent-plugin-http-healthcheck
- fluent-plugin-kv-parser
I will start with the Kubernetes setup here and go into details about the actual FluentD config later.
One nice thing I was able to do in my Helm chart is the way the config files are delivered. They are all put into a single ConfigMap, automatically, without me having to adapt the Kubernetes manifests when adding a new config file.
In my chart root directory, I’ve got a subdirectory configs/, where I store
all of the FluentD config files. Then I’ve got the following ConfigMap:
apiVersion: v1
kind: ConfigMap
metadata:
  name: fluentd-conf
  labels:
    {{- range $label, $value := .Values.commonLabels }}
    {{ $label }}: {{ $value | quote }}
    {{- end }}
data:
{{ (tpl (.Files.Glob "configs/*").AsConfig .) | indent 2 }}
The magic is all in the last line. First, the Files.Glob function gets a number
of Files objects from the configs/* path. The AsConfig method then turns
each of those objects into the proper format to work in a ConfigMap’s data:
key. This happens by formatting it like this, for a file at configs/redis-k8s.conf:
redis-k8s.conf: |
  # Log configuration for Redis on k8s

  <filter services.redis.redis>
    @type parser
    key_name log
    reserve_data true
    remove_key_name_field true
    <parse>
      @type regexp
      expression /^[0-9]+:[XCSM] (?<logtime>[0-9]{2} [A-Za-z]{3} [0-9]{4} [0-9]{2}:[0-9]{2}:[0-9]{2}.[0-9]{3}) (?<level>[\.\-\*\#]) [^$]+$/
      time_key logtime
      time_type string
      utc true
      time_format %d %b %Y %H:%M:%S.%N
    </parse>
  </filter>
Finally, tpl is called on the result, as I’m referencing Helm chart values in
some of the config files. The only thing I’m a bit worried about is the maximum
size of a Kubernetes resource, which may be hit at some point with this approach.
Speaking of the Helm chart values, here they are:
commonLabels:
  homelab/part-of: fluentd
ports:
  syslog: 5144
  syslogTls: 6514
  logShippers: 24225
  netconsole: 6666
  health: 8888
  k8sLogs: 24230
mountDir: /fluentd/log
Again relatively simple, as I can configure most things by just changing the
templates directly. The netconsole here is a port for the kernel’s netconsole,
which I’m using for my netbooting hosts to see the early boot process without
having to connect them. That post has been sitting in my repo as a draft since
I started the k8s migration plan back in December. 😅
The logShippers port is used by the Fluentbit instances deployed on Nomad,
while the k8s logs are send to the k8sLogs port.
There’s again a scratch volume involved, which is used for on-disk buffers before logs are send over to Loki, so that there’s no loss when the FluentD container is suddenly killed:
apiVersion: v1
kind: PersistentVolumeClaim
metadata:
  name: scratch-volume
  labels:
    {{- range $label, $value := .Values.commonLabels }}
    {{ $label }}: {{ $value | quote }}
    {{- end }}
spec:
  storageClassName: rbd-fast
  accessModes:
    - ReadWriteOnce
  resources:
    requests:
      storage: 4Gi
And here is the Deployment for FluentD:
apiVersion: apps/v1
kind: Deployment
metadata:
  name: fluentd
  labels:
    {{- range $label, $value := .Values.commonLabels }}
    {{ $label }}: {{ $value | quote }}
    {{- end }}
spec:
  replicas: 1
  selector:
    matchLabels:
      app: fluentd
      {{- range $label, $value := .Values.commonLabels }}
      {{ $label }}: {{ $value | quote }}
      {{- end }}
  strategy:
    type: "Recreate"
  template:
    metadata:
      labels:
        app: fluentd
        {{- range $label, $value := .Values.commonLabels }}
        {{ $label }}: {{ $value | quote }}
        {{- end }}
      annotations:
        checksum/config: {{ include (print $.Template.BasePath "/config.yaml") . | sha256sum }}
    spec:
      automountServiceAccountToken: false
      securityContext:
        fsGroup: 1000
      containers:
        - name: fluentd
          image: registry.mei-home.net/homenet/fluentd:{{ .Values.appVersion }}
          volumeMounts:
            - name: scratch
              mountPath: {{ .Values.mountDir }}
            - name: config
              mountPath: /fluentd/etc
              readOnly: true
          resources:
            requests:
              cpu: 200m
              memory: 500Mi
          env:
            - name: HL_NODE_NAME
              valueFrom:
                fieldRef:
                  fieldPath: spec.nodeName
          livenessProbe:
            httpGet:
              port: {{ .Values.ports.health }}
              path: "/"
            initialDelaySeconds: 15
            periodSeconds: 30
          ports:
            - name: syslog-tcp
              containerPort: {{ .Values.ports.syslog }}
              protocol: TCP
            - name: syslog-udp
              containerPort: {{ .Values.ports.syslog }}
              protocol: UDP
            - name: syslog-tls
              containerPort: {{ .Values.ports.syslogTls }}
              protocol: TCP
            - name: log-shippers
              containerPort: {{ .Values.ports.logShippers }}
              protocol: TCP
            - name: k8s
              containerPort: {{ .Values.ports.k8sLogs }}
              protocol: TCP
            - name: netconsole
              containerPort: {{ .Values.ports.netconsole }}
              protocol: UDP
      volumes:
        - name: scratch
          persistentVolumeClaim:
            claimName: scratch-volume
        - name: config
          configMap:
            name: fluentd-conf
The only new thing I learned here is how to access fields from the Pod spec
via environment variables, which I use to put the node name into the HL_NODE_NAME
env variable. I later use this to add the node name to FluentD’s own logs.
Next, the service. This is of type LoadBalancer, as FluentD does not only handle the internal cluster logs, but also the logs from all of my hosts.
apiVersion: v1
kind: Service
metadata:
  name: fluentd
  labels:
    {{- range $label, $value := .Values.commonLabels }}
    {{ $label }}: {{ $value | quote }}
    {{- end }}
    homelab/public-service: "true"
  annotations:
    external-dns.alpha.kubernetes.io/hostname: log-aggregator.example.com
    io.cilium/lb-ipam-ips: "10.86.55.66"
spec:
  type: LoadBalancer
  externalTrafficPolicy: Local
  selector:
    {{- range $label, $value := .Values.commonLabels }}
    {{ $label }}: {{ $value | quote }}
    {{- end }}
    app: fluentd
  ports:
    - name: syslog-tcp
      port: 514
      targetPort: syslog-tcp
      protocol: TCP
    - name: syslog-udp
      port: 514
      targetPort: syslog-udp
      protocol: UDP
    - name: syslog-tls
      port: {{ .Values.ports.syslogTls }}
      targetPort: syslog-tls
      protocol: TCP
    - name: log-shippers
      port: {{ .Values.ports.logShippers }}
      targetPort: log-shippers
      protocol: TCP
    - name: k8s
      port: {{ .Values.ports.k8sLogs }}
      targetPort: k8s
      protocol: TCP
    - name: netconsole
      port: {{ .Values.ports.netconsole }}
      targetPort: netconsole
      protocol: UDP
While setting up the service, I realized that I had forgotten the syslog-udp
entry in the port list. I added it, but the service did not show any Endpoints
for that particular port:
Port:                     syslog-udp  514/UDP
TargetPort:               syslog-udp/UDP
NodePort:                 syslog-udp  31268/UDP
Endpoints:
I tried to fix this by recreating the Pod, but to no avail. I finally found this blog post, which proposed not just deleting the Pod, but also the Deployment - and that did the trick.
Another issue I hit came after I switched the syslog-ng configs for all of my hosts over to the new FluentD on k8s. All hosts worked well - safe for all of my k8s nodes! None of them was able to connect to the FluentD service. After quadruple-checking my Firewall config, I finally had another facepalm moment. My CiliumNetworkPolicy looked like this:
apiVersion: "cilium.io/v2"
kind: CiliumNetworkPolicy
metadata:
  name: "fluentd"
  labels:
    {{- range $label, $value := .Values.commonLabels }}
    {{ $label }}: {{ $value | quote }}
    {{- end }}
spec:
  endpointSelector: {}
  ingress:
    - fromEndpoints:
      - {}
      - matchLabels:
          io.kubernetes.pod.namespace: fluentbit
          homelab/part-of: fluentbit
    - fromEntities:
      - world
The issue with this config is: world doesn’t mean “absolutely everybody”. It
only means “everybody outside the k8s cluster”. So my desktop, all
of my Nomad cluster nodes and my baremetal Ceph nodes were allowed - but the
k8s nodes were not! I’m wondering how often I will read through the Cilium docs
before this migration is over. 😅
The solution is to add remote-node and host to the fromEntities list,
like this:
- fromEntities:
  - world
  - remote-node
  - host
remote-node allows all cluster nodes which are not running the FluentD Pod
access, while host is specifically the node which is currently running the Pod.
But that was still not all the problems I had with the syslogs setup. In my old
config, I had configured FluentD to check the IP address of the sender and look
it up in DNS to set the host field of the log message. For the life of me,
I cannot remember why I would do such a thing.
The problem was, again, with the k8s hosts. They were showing up with IPs, not
their proper hostnames. I recognized the IPs as the ones which Cilium assigns
to the cilium_host interface it creates. Those IPs are not routable in my
wider network and there are no corresponding PTR records in my DNS.
To realize that that was my problem, I had to break out Wireshark yet again. This is becoming a theme in this migration. Looking closer at the messages, I was able to see that the host field was set properly. An example message looked like this:
<30>1 2024-01-29T22:16:56+01:00 khepri.home kubelet 19562 - - W0129 22:16:56.971140 19562 machine.go:65] Cannot read vendor id correctly, set empty.
And this host field, khepri.home here, should be used by default. But it wasn’t,
due to having this option set:
source_hostname_key host
This makes FluentD go out to DNS, instead of just using the host field from the message. Ah well, it had been almost two weeks since I last had to get out Wireshark anyway. 😒
Last but most certainly not least was a problem with OPNsense. I had reconfigured the logging target to the new domain, but nothing happened. No proper log entries, nothing. Turns out, after an hour or so of debugging: OPNsense’s syslog-ng needed a full restart, not just a config reload, to start using the new values. 🤦
FluentD configs
Before moving on to Fluentbit and the k8s logs, I want to at least have a short look at my FluentD base config and the syslog configs.
My main config file for FluentD looks like this:
<system>
  log_level info
</system>
# Fluentd's own logs
# This is only intended to prepare the logs for forwarding
# to the services loki instance!
<label @FLUENT_LOG>
	<match fluent.**>
		@type record_modifier
		@label @K8S
		tag services.fluentd.fluentd
		<record>
          namespace_name fluentd
          container_name fluentd
          host "#{ENV['HL_NODE_NAME']}"
          level ${tag_parts[1]}
		</record>
	</match>
</label>

# Healthcheck endpoint
<source>
  @type http_healthcheck
  port {{ .Values.ports.health }}
  bind 0.0.0.0
</source>

# Syslog Handling
@include syslogs.conf

# Service logs coming from the Nomad jobs
@include nomad-srv-logs.conf

# k8s logs
@include k8s.conf
The main part is the configuration of FluentD’s own logs. With this config,
they’re still put to stdout, but they’re also forwarded to my K8S label.
I will show that later. Now that I look at the config, it might be interesting
to see whether I could also provide the namespace and container name as ENV
variables and set the record content from those, instead of hardcoding them
here.
In the syslogs.conf file, I’m setting up the syslog handling:
<source>
	@type syslog
	port {{ .Values.ports.syslogTls }}
	bind 0.0.0.0
	tag syslogs.new
  severity_key level
	frame_type octet_count
	<transport tcp>
	</transport>
	<parse>
		message_format auto
	</parse>
</source>

<filter syslogs.new.**>
  @type grep
  <exclude>
    key message
    pattern /^.* too long to fit into unit name, ignoring mount point\.$/
  </exclude>
</filter>

<match syslogs.**>
  @type route
  <route syslogs.**>
    @label @SYSLOGS
    copy
  </route>
</match>

<label @SYSLOGS>
  <match syslogs.**>
    @type loki
    url "http://loki.loki.svc.cluster.local:3100"
    extra_labels {"job":"syslogs"}
    <label>
      host $.host
    </label>
    <buffer host>
      path /fluentd/log/buffers/loki.syslog.*.buffer
      @type file
      total_limit_size 5GB
      flush_at_shutdown true
      flush_mode interval
      flush_interval 5s
      chunk_limit_size 5MB
    </buffer>
  </match>
</label>
I have removed some content here, as a lot of it is repetitive code for the different ports I need to listen on for the different syslog formats and transports.
The <source> will listen on the syslogTLS port for incoming syslog messages
and tag them properly. The parsing, luckily, can be automated as FluentD has
the ability to automatically detect whether it’s an RFC3164 or a RFC5424 formatted
message.
In the @type grep filter, I’m dropping one specific log line, looking like this:
Mount point path '/var/lib/kubelet/plugins/kubernetes.io/csi/rook-ceph.rbd.csi.ceph.com/7fa64edb6fced4ed6d5acd3643506bc6a3ea6bea547f6a6c2997653e203f4857/globalmount/0001-...too long to fit into unit name, ignoring mount point
These incredibly annoying lines are send by systemd, with warning severity.
See e.g. this docker bug report.
These messages also come up on my Nomad cluster, for the same reason, CSI mounts.
But from the GitHub issue it seems like there’s now a way in systemd to do
this? Anyway, for now I’m filtering in FluentD to not have the endless repeats
of that line every 10 seconds pollute my logs.
Finally, I’m using the SYSLOGS label. Labels in FluentD are something like
subtrees in the log pipeline. By default, every log record flows from the point
where its <source> is until it hits a <match> section which fits its tag.
With labels, subsections combining several <filter> and <match> sections
can be created.
In this particular example, nothing special done, just the
match section for the Loki output plugin. I’m setting the URL of the internal
Loki service. The <label> section defines which Loki labels are set for the
log entry. Labels are Loki’s index. It can search over the entirety of a log
entry, but the labels are more efficient, especially with separate log sources
like I have here, with container logs and host logs. For this I’m setting the
job label, syslogs here. In addition, any given syslog stream is also
identified uniquely by the host which emitted the log, which is why I’m adding
the host field as another label. All other fields in the record, like the syslog
ident, will also be stored in Loki of course, but they will simply be part of
the log line, and will not be indexed.
I’m also setting up some local buffering, again with the host key as the buffer key. I’m giving the buffer a rather generous 5GB of max size, just to make sure I don’t run out of space for logs if something goes down during the night and subsequent workday.
Fluentbit setup
Final component of the logging setup: Fluentbit. There’s quite a large choice of log shippers. I ended up deciding on Fluentbit because I was already running FluentD at the point where I wanted per-host log shippers.
As I had mentioned in the overview, Fluentbit is mostly a dump log shipper for me, its config is kept pretty simple, letting FluentD do the heavy lifting. For that reason, I was finally able to use an official Helm chart in this migration. Fluentbit’s can be found here.
The general part of the values.yaml looks like this:
testFramework:
  enabled: false
serviceMonitor:
  enabled: false
tolerations:
  - key: "homelab/taint.role"
    operator: "Equal"
    value: "ceph"
    effect: "NoSchedule"
  - effect: NoSchedule
    key: node-role.kubernetes.io/control-plane
    operator: Exists
labels:
  homelab/part-of: fluentbit
podLabels:
  homelab/part-of: fluentbit
priorityClassName: "system-node-critical"
Only noteworthy part is setting the tolerations, so that Fluentbit is also deployed on control plane nodes and, in my case, Ceph nodes. I’ve also decided to declare it node-critical, to prevent eviction.
More interesting than that is the config: section:
config:
  inputs: |
    [INPUT]
        Name tail
        Path /var/log/containers/*.log
        multiline.parser cri
        Tag kube.*
        Mem_Buf_Limit 5MB
  filters: |
    [FILTER]
        Name kubernetes
        Match kube.*
        Merge_Log On
        Keep_Log Off
        K8S-Logging.Parser On
        K8S-Logging.Exclude On
        Annotations off
    [FILTER]
        Name nest
        Match kube.*
        Operation lift
        Nested_under kubernetes
    [FILTER]
        Name    modify
        Match   kube.*
        Remove pod_id
        Remove docker_id
        Remove container_hash
        Remove container_image
    [FILTER]
        Name    grep
        Match   kube.*
        Exclude namespace_name fluentd
  outputs: |
    [OUTPUT]
        Name          forward
        Match         *
        Tag           services.$namespace_name.$container_name
        Host          fluentd.fluentd.svc.cluster.local
        Port          24230
        Retry_Limit   50
At the top is the tail input.
It reads all the log files in /var/log/containers, which is mounted into the
Fluentbit container from the host. I’ve set the parser to cri, as that’s the
format cri-o writes.
The first and most interesting filter is Kubernetes.
This plugin first extracts some data from the tag, namely the namespace, Pod name,
container name and container id. This is taken from the filename by the tail
plugin. A log file for a cilium pod would look like this:
cilium-tmlqp_kube-system_cilium-agent-eb472a8bae2b95836acc51f70986c7bd2f659f0d69e4aff8b9f9fa80fef5d565.log.
Where cilium-tmlqp is the Pod name, kube-system the Namespace, cilium-agent
the container name and finally the uuid is the container ID.
But the Kubernetes filter can extract additional data, by contacting the kube-apiserver. These are the Pod ID, labels and annotations. In my config, I’ve disabled the annotations, because I don’t find them too interesting in logging. The labels, on the other hand, might come in handy. One important thing to note about the Kubernetes filter: It needs to get this additional data from the kube-apiserver. There’s some caching, and I’ve not found any increased load on my kube-apiserver. But depending on how busy a cluster is, meaning how many new pods appear in any given timeframe, the load on the kube-apiserver might go pretty high.
The Kubernetes filter puts all of the keys it adds under a kubernetes key. I
don’t find that particularly useful. That’s why I raise all keys under kubernetes
by one level with the nest filter.
With the modify filter I’m also removing some pieces of the log info I deem
superfluous in my log records.
The final filter, An endless loop.grep, is immensely important for a stable and useful
FluentD+Fluentbit setup. Imagine the following scenario: For debugging purposes,
you use FluentD’s stdout filter, which
does nothing else than writing an entire log record to the stdout of the FluentD
container. Now, if we were collecting the FluentD log file and feeding it back
into FluentD, that would also then be output on stdout again - ad infinitum.
This is the end result:
The OUTPUT part then transfers the logs to FluentD. I’m setting the tag as the
Namespace name and the container name. These make the most sense as identifiers
from the data I have. I would have loved to also add the Pod name as another
key, but this has a problem: The Pod name as provided might have some hashes
attached. E.g. for the Cilium pod example from before, the Pod name would be
cilium-tmlqp. This hash changes when the Pod spec changes. While this is a
good idea to uniquely identify Pods, it isn’t too useful for logs. Because
generally speaking, when looking at logs, I’m interested in the logs for a
specific app, not (necessarily?) of a specific Pod from that app.
In addition, these unique identifiers also later form the labels for Loki, and
labels with too high cardinality are bad for Loki’s performance.
Setting up k8s component logs
Before finishing up, I would also like to show what my k8s log handling looks
like in FluentD. As described above, the logs from the k8s containers arrive
in FluentD via the Forward protocol. The tag defined in the Fluentbit OUTPUT
section arrives untouched in the following <source>:
<source>
  @type forward
  port {{ .Values.ports.k8sLogs }}
  bind 0.0.0.0
  @label @K8S
</source>
This source just ensures that all log records are routed to the K8S label.
A log, when it arrives at FluentD, looks like this:
time=>"2024-02-12T18:44:35.624186596+01:00",
stream=>"stderr",
_p=>"F",
log=>"2024-02-12 17:44:35.624124 I | sys: Device found - mmcblk0boot1",
pod_name=>"rook-discover-d9tcf",
namespace_name=>"rook-ceph",
labels=>{
  app=>"rook-discover",
  app.kubernetes.io/component=>"rook-discover",
  app.kubernetes.io/created-by=>"rook-ceph-operator",
  app.kubernetes.io/instance=>"rook-discover",
  app.kubernetes.io/managed-by=>"rook-ceph-operator",
  app.kubernetes.io/name=>"rook-discover",
  app.kubernetes.io/part-of=>"rook-ceph-operator",
  controller-revision-hash=>"799f867d7",
  pod-template-generation=>"3",
  rook.io/operator-namespace=>"rook-ceph"
},
host=>"khepri",
container_name=>"rook-discover"
The only thing I’m touching in FluentD is the log key. My goal is to extract
two pieces of information from it: First and foremost, the severity level of the
log. And let me tell you: This is wild. Because not only can the tech industry
not agree on a log format - no, it can’t even agree on universal identifiers
for different log levels!
To extract the proper log line, I have separate Parser filters in my config, for each individual app. Because yes, it’s the Wild West out there when it comes to logging formats. Even within the same app! 😠
The above example is from a Ceph container. It would be parsed by this config:
<filter services.{rook-cluster,rook-ceph}.{watch-active,provision,rook-ceph-operator,rook-discover}>
  @type parser
  key_name log
  reserve_data true
  remove_key_name_field true
  <parse>
    @type multi_format
    <pattern>
      format regexp
      expression /^(?<logtime>[0-9\-]+ [0-9\:\.]+) (?<level>[^ ]+) \| (?<cmd>[^:]+)\: (?<msg>.*)$/
      time_key logtime
      time_format %F %T.%N
      utc true
    </pattern>
    <pattern>
      format regexp
      expression /^(?<msg>.*)$/
      time_key nil
    </pattern>
  </parse>
</filter>
As you can see, this format is used by a number of other Ceph containers as well.
But you can also see: Besides these well-formatted lines, there are also others
which defy any formatting and hence just get a generic .* regex. And don’t
be fooled: There are five other sections just like this one, just to parse logs
from all the Ceph Rook containers running in my cluster.
So what’s happening here, exactly? First of all, there’s the tag capture at the
top. This determines which logs are handled by this filter. In my logs, the
tags have the format services.NAMESPACE.CONTAINER. The key_name provides
the record key the parser should look at. reserve_data true tells the parser
to leave all other fields in the record, untouched. remove_key_name_field true
says that the parser should remove the log field from the record when parsing
was successful. If parsing fails, the record is left completely untouched.
I’m using a multi_format parser here, as the containers spit out logs in
multiple formats. Then, I chose the regexp parser and provide a regex to
parse the log content.
I can very warmly recommend https://regex101.com. It has
served me very well, both during this migration, and ever since I’ve started
using FluentD in the Homelab.
One note on the named capture groups in the regexes: Those are transformed into
additional keys in the record.
Then there’s the time handling. As whatever log lib the Ceph containers are using
here is too cool to use ISO8601, I
need to not only specify in which key the time can be found, but also need to
define a format.
This can also be skipped, as seen in the second pattern section. In this case,
the time the record was originally received by Fluentbit is used.
Now, back to defining log levels. Here’s the config I use to align to a single identifier for each log level:
<filter parsed.services.**>
  @type record_modifier

  <replace>
      key level
      expression /^(crit|CRIT|ALERT|alert|4)$/
      replace critical
  </replace>
  <replace>
      key level
      expression /^(ERROR|eror|ERR|err|E|3)$/
      replace error
  </replace>
  <replace>
      key level
      expression /^(DEBUG|dbg|DBG|0|\.|\-)$/
      replace debug
  </replace>
  <replace>
      key level
      expression /^(INFO|Info|INF|inf|I|NOTICE|1|\*)$/
      replace info
  </replace>
  <replace>
      key level
      expression /^(WARN|warn|WRN|wrn|W|WARNING|2|\#)$/
      replace warning
  </replace>
</filter>
Note, in particular, the ./-/*/#. That’s Redis’ wild way of defining log
severity. See also this blog post.
Why? Why can’t we define one format? I’m not asking for a unified log format at this point. But perhaps - perhaps we can at least have unified identifiers for the levels? And also, please: Every single log line should have a severity attached. That’s just basic, good engineering.
One last thing to consider: How to find out whether a log line slipped through unparsed? For this, I’m employing a rewrite_tag_filter:
<match services.**>
  @type rewrite_tag_filter
  <rule>
    key log
    pattern /^.+$/
    tag unparsed.${tag}
  </rule>
  <rule>
    key log
    pattern /^.+$/
    tag parsed.${tag}
    invert true
  </rule>
</match>
This filter comes after all the different parser filters. So when, at this
point, a log record still has the log key, it means none of the parser
filters was applied to it. These then get unparsed added to their tag.
There is one important point about rewrite_tag_filter: It re-emits the log
record. So the record runs through the entire chain of filters again. This
can easily lead to an endless chain. Imagine I only added the unparsed tag
to unparsed logs, but left parsed logs completely untouched, instead of
prepending them with the parsed tag. Then, the parsed tags would start the
filter chain again, completely unchanged - and run into this rewrite_tag_filter
again! And then again. And again. Producing a nice endless loop. So when using
a rewrite_tag_filter, always remember to make sure that you change the tags
on all log lines which might hit them.
These unparsed records then go into a record_transformer
filter:
  <filter unparsed.**>
    @type record_transformer
    enable_ruby true
    renew_record true
    <record>
      unparsed-log ${record}
      namespace_name hl-dummy
      container_name hl-unparsed-logs
      fluentd-tag ${tag}
      level warn
    </record>
  </filter>
Here I’m putting the entire unparsed log into a subkey unparsed-log. This
also shows off the flexibility of FluentD in manipulating log records. I’m also
adding a hardcoded namespace and container name. As those two keys are later
used by Loki to index logs. I’m also using them in Grafana for filtering.
And so with this setup, I just need to look at the hl-dummy/hl-unparsed-logs
logs to see whether there’s some new logs, or whether perhaps an older regex
needs adaption to a newer format.
And finally, just for completeness’ sake, the output to Loki:
<match {parsed,unparsed}.services.**>
    @type loki
    url "http://loki.loki.svc.cluster.local:3100"
    extra_labels {"job":"k8s-logs"}
    <label>
        namespace $["namespace_name"]
        container $["container_name"]
    </label>
    <buffer namespace_name,container_name>
        path /fluentd/log/buffers/loki.k8s.*.buffer
        @include loki-buffers.conf
    </buffer>
</match>
The loki-buffers.conf file has the same content as in the syslog example
above.
Conclusion
And that’s it! My logging stack, completely migrated to k8s. This was the first service I actually migrated, and where I could remove jobs from Nomad, namely the FluentD and Loki jobs. It is now only running its own Fluentbit job, which transfers the logs to the FluentD instance running on k8s.
One thing I’ve noted for the future: Start actively monitoring the logs. I had a slightly panicky Sunday morning due to some malicious bash code showing up in my logs when I went to check whether everything had worked. Read all about it. I just so happened to see that log because it happened to be at the very top when I opened my logging dashboard. Otherwise, I would have completely overlooked it.
The last thing to do for this migration is to have a look at the unparsed logs in a week or so and make sure I haven’t forgotten anything.