Wherein I ran into some problems with the Cilium BGP routing and firewalls on my OPNsense box.
This is the second addendum for Cilium load balancing in my k8s migration series.
While working on my S3 bucket migration, I ran into several rather weird problems. After switching my internal wiki over to using the Ceph RGW S3 from my k8s Ceph Rook cluster, I found that the final upload of the generated site to the S3 bucket from which it was served did not work, even though I had all the necessary firewall rules configured. The output I was getting looked like this:
WARNING: Retrying failed request: / ([Errno 110] Operation timed out)
WARNING: Waiting 3 sec...
WARNING: Retrying failed request: / ([Errno 110] Operation timed out)
WARNING: Waiting 6 sec...
WARNING: Retrying failed request: / ([Errno 110] Operation timed out)
WARNING: Waiting 9 sec...
WARNING: Retrying failed request: / ([Errno 110] Operation timed out)
WARNING: Waiting 12 sec...
WARNING: Retrying failed request: / ([Errno 110] Operation timed out)
WARNING: Waiting 15 sec...
ERROR: S3 Temporary Error: Request failed for: /.  Please try again later.
I initially thought that something was wrong with the Rook setup here, but this
didn’t seem to be the case - uploading something to a test bucket from my C&C
host worked fine. Same for uploads from my workstation.
Before going on, let me show you a small networking diagram: Perfect example of asymmetric routing.
This is a picture-perfect example of asymmetric routing. The S3 service is announced via a LoadBalancer service and Cilium’s BGP functionality. All my LoadBalancer services are in a separate subnet from the hosts themselves. So to reach the S3 service, all packets need to go through the OPNsense box.
This is obviously not ideal, as now the uplink to the router’s interface becomes a bottleneck. This could in theory be fixed by using L2 announcements instead, but those put a pretty high load on the k8s control plane nodes, through using k8s leases. And the load scales with the amount of hosts in the k8s cluster.
But in this particular case, the problem is asymmetric routing. The Nomad host running the CI jobs trying to access the S3 buckets will use the LoadBalancer IP, accessing the Ceph RGW through my Traefik ingress. This IP is in a different subnet than the hosts, and hence the packets go through the default gateway, which is my OPNsense box. There, they are routed to the next hop, which is the k8s node currently running my ingress. From there, they’re finally routed internally to the Ceph RGW pod.
But on the return path for the response packets, they go directly from the host running the RGW pod to the host running the CI job. This is due to the fact that both hosts are in the same subnet.
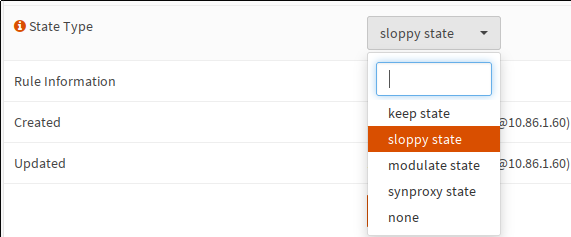
The first consequence of this is the need to change the firewall rules for accessing the Traefik ingress LoadBalancer service IP from the Homelab. Initially, my rule used the default state tracking setting. But in this case, that does not work. The firewall will see the initial TCP SYN packet coming from the CI job host, but it won’t see the SYN and ACK from the ingress, because those are send directly from host to host, not via the router. Seeing only one side of the connection, the firewall still blocks subsequent packets.
The solution to this is to change the way OPNsense tracks connections for
the specific rule allowing access to the ingress from the Homelab VLAN. This can
be done in the rule’s options, under “Advanced features”: The state type for rules which concern asymmetric routing needs to be set to ‘sloppy state’
That was this problem fixed, and the upload started working - but incredibly slowly. I got long phases with no transmission at all and some retries. It looked like this:
upload: './public/404.html' -> 's3://wiki/404.html'  [1 of 97]


 9287 of 9287   100% in    0s     3.35 MB/s
 9287 of 9287   100% in    0s    33.80 KB/s  done

upload: './public/categories/index.html' -> 's3://wiki/categories/index.html'  [2 of 97]


 34120 of 34120   100% in    0s     6.75 MB/s
 34120 of 34120   100% in    0s   304.53 KB/s  done

upload: './public/ceph/index.html' -> 's3://wiki/ceph/index.html'  [3 of 97]


 34195 of 34195   100% in    0s     5.34 MB/s
 34195 of 34195   100% in    0s     5.34 MB/s  failed

WARNING: Upload failed: /ceph/index.html (The read operation timed out)

WARNING: Waiting 3 sec...

upload: './public/ceph/index.html' -> 's3://wiki/ceph/index.html'  [3 of 97]


 34195 of 34195   100% in    0s   769.35 KB/s
 34195 of 34195   100% in    0s   101.93 KB/s  done

upload: './public/ceph/index.xml' -> 's3://wiki/ceph/index.xml'  [4 of 97]
The pattern here seemed to be: Initially, the uploads work for a very short while, and then they stop working. And at some later point, the transmission works again.
Setting up an iperf3 Pod
I wasn’t able to make anything of the log output, so I build myself a test setup with an iperf3 pod in the k8s cluster, made available via a LoadBalancer service similar to how my ingress is made available.
As the basis, I’m using the network-multitool
container, in the :extra variant. I’m launching the Pod via this Deployment:
apiVersion: apps/v1
kind: Deployment
metadata:
  name: network-multitool
spec:
  replicas: 1
  selector:
    matchLabels:
      app: network-multitool
  template:
    metadata:
      labels:
        app: network-multitool
    spec:
      containers:
        - name: network-multitool
          image: wbitt/network-multitool:extra
          command: ["iperf3"]
          args:
            - "-p"
            - "55343"
            - "-s"
          ports:
            - name: http-port
              containerPort: 8080
            - name: iperf-port
              containerPort: 55343
By default, the container runs a simple webserver. I’m changing that here to running an iperf3 instance in server mode. In addition, I’ve created the following Service to make the iperf3 server externally available:
apiVersion: v1
kind: Service
metadata:
  name: iperf
  labels:
    app: network-multitool
    homelab/public-service: "true"
  annotations:
    external-dns.alpha.kubernetes.io/hostname: iperf-k8s.example.com
    io.cilium/lb-ipam-ips: 10.86.55.12
spec:
  type: LoadBalancer
  externalTrafficPolicy: Local
  selector:
    app: network-multitool
  ports:
    - name: iperf-port
      protocol: TCP
      port: 55343
      targetPort: 55343
Once that service is created, Cilium will announce a route to the IP 10.86.55.12
with the k8s node currently running the iperf3 Pod as the next hop. This
route will be used by my OPNsense box. As the 10.86.55.0/24 subnet is not the
same as my Homelab VLAN’s subnet, all traffic to the iperf3 instance will go
through the OPNsense box.
I started with a simple test, running from a different host inside the Homelab
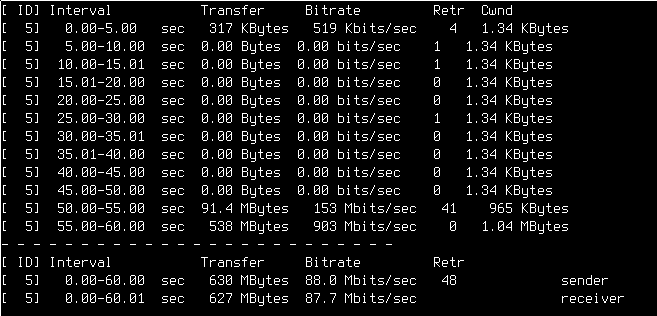
VLAN. Transfer from a Homelab host as the iperf3 client.
This test showed a somewhat similar behavior. Initially, the transmission works,
but then it just stops. For about 45 seconds, in this case. And then, rather
suddenly, the transmission starts up again. At least I had the ability to
repeat the problem at will now.
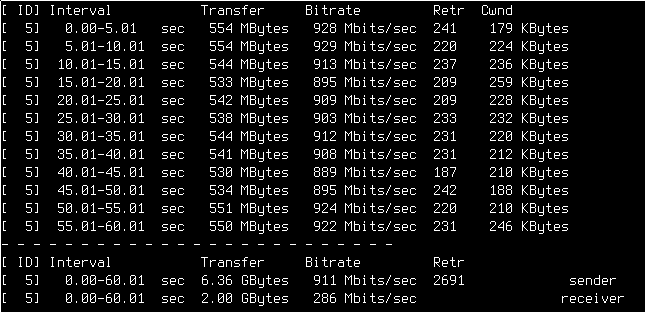
I conducted a separate test, this one from my workstation, which is in a separate
VLAN: Same iperf3 server in a k8s Pod, but with my workstation, from my management VLAN, showing the expected (almost) line speed.
So, from the management VLAN, I get full line speed, and no weird gaps in the transmission. There are two differences here: First, the Homelab VLAN transmission happened over the same VLAN, with the node hosting the iperf3 pod being in the same subnet as the client. The second difference, and as it turns out, the more relevant one, is that the management VLAN has very few firewall rules, while the Homelab is nailed pretty much shut.
So I went investigating some more. As seems to be the case way too often in this Kubernetes migration, it was Wireshark o’clock again.
The initial packet capture, from both the iperf3 pod and the client on another host, showed exactly what I was expecting, there was just a big, about 45 seconds long hole in the traffic I couldn’t explain, before the traffic started up again.
I also gathered some data on my router, specifically on the interface which leads to my Homelab. And it showed something interesting.
First, here is the initial, successful transmission:
113 0.058354 10.86.5.125 10.86.55.12 TCP 1434 55643 → 55343 [ACK] Seq=62966 Ack=1 Win=64256 Len=1368 TSval=115511759 TSecr=1303863917
Then, and this is the important point, comes a second transmission, seemingly of the same packet, which is marked by Wireshark as a TCP re-transmission:
114 0.058357 10.86.5.125 10.86.55.12 TCP 1434 [TCP Retransmission] 55643 → 55343 [ACK] Seq=62966 Ack=1 Win=64256 Len=1368 TSval=115511759 TSecr=1303863917
What this actually is becomes obvious when looking at the L2 source MAC address. The first packet is arriving from the MAC that belongs to the Pi I was running the iperf3 client on, with the target MAC being the interface for Homelab VLAN traffic on my OPNsense box. The second packet, though, was send out with the MAC of the OPNsense box, with the MAC of the next hop host of the LoadBalancer IP as a target.
And now comes the interesting part. After some successful transmissions, the following happens:
158	0.059077	10.86.5.125	10.86.55.12	TCP	1434	55643 → 55343 [ACK] Seq=121790 Ack=1 Win=64256 Len=1368 TSval=115511759 TSecr=1303863918
[...]
165	0.059217	10.86.5.125	10.86.55.12	TCP	1434	55643 → 55343 [ACK] Seq=131366 Ack=1 Win=64256 Len=1368 TSval=115511759 TSecr=1303863918
[...]
175	54.149140	10.86.5.125	10.86.55.12	TCP	1434	[TCP Retransmission] 55643 → 55343 [ACK] Seq=65702 Ack=1 Win=64256 Len=1368 TSval=115565850 TSecr=1303863918
All of these packets, right up to the last one at sequence number 175, are coming from the Raspberry Pi serving as a client. At the same time, I’m not seeing any packets at all coming out of the OPNsense box, like the second packet from the previous sequence. This looks like the firewall just blackholes the packets, or as if routing temporarily fails. And then it starts working again, without me actually doing anything:
176	54.149156	10.86.5.125	10.86.55.12	TCP	1434	[TCP Retransmission] 55643 → 55343 [ACK] Seq=65702 Ack=1 Win=64256 Len=1368 TSval=115565850 TSecr=1303863918
177	54.150365	10.86.5.125	10.86.55.12	TCP	1434	55643 → 55343 [ACK] Seq=135470 Ack=1 Win=64256 Len=1368 TSval=115565851 TSecr=1303918009
178	54.150400	10.86.5.125	10.86.55.12	TCP	1434	[TCP Retransmission] 55643 → 55343 [ACK] Seq=135470 Ack=1 Win=64256 Len=1368 TSval=115565851 TSecr=1303918009
Here the behavior is the same as in the beginning: The packet arrives with the Pi as the source MAC and then leaves again with the firewall’s MAC as the source.
And I’m still not sure what this is all about - the suspicious, about 45 second interval where no packets are routed. So I will call my solution a workaround, and not a fix - because I might have just fought a symptom, instead of the root problem.
The fix was to create another firewall rule, allowing access from the Homelab VLAN to the IP of the iperf LoadBalancer. This must sound weird. But in my initial configuration, I only allowed the Homelab access to specific other machines on specific ports, and I normally only have inbound rules for most stuff besides the IoT VLAN.
What I did in OPNsense was to create an OUT rule, allowing access from the Homelab VLAN to the IP of the iperf LoadBalancer service. And all of a sudden, it all started working.
What’s annoying me is that I have no explanation at all for this kind of behavior. I mean sure, I think I understand why the firewall would block the packet when it tries to leave the OPNsense box in the direction of my Homelab. But - why does the iperf transmission start to work, all of a sudden? And why does it work at the very beginning of the transmission? That’s what I don’t get. If the missing firewall rule was the root cause, shouldn’t it not work at all - instead of just not work for 45 seconds in the middle of a connection?
And I’ve also tried longer transmissions, e.g. 2 minutes instead of one. And here I saw the same pattern. First the couple of successful packets, then a 45 second hole, and then it worked for the entire remaining 1 minute of the test.
If any of my readers has any idea what’s going on here, why I need the firewall rule, and why only some part of the iperf transmission was blocked, I would be very happy to hear about it on Mastodon.
Conclusion
To summarize, when setting up Cilium BGP within a pretty restricted OPNsense
firewall environment, check whether you’ve got asymmetric routing going on.
If so, set the state tracking for the rule allowing access to the LoadBalancer
IP to sloppy state. In addition, add an outgoing rule on the VLAN of the
next hop advertised in the route to the LoadBalancer IP to make sure packets
don’t get randomly dropped.
Finally, I’m sadly still not sure what exactly is going on here.
