
Wherein I migrate my Grafana instance over to k8s.
This is part 11 of my k8s migration series.
I already wrote about my love for metrics in the companion post about the Prometheus setup, so I will spare you my excitement about pretty graphs this time. 😉
For the Grafana setup, I used the kube-prometheus-stack’s integration of the Grafana Helm Chart.
Database setup
First step is to setup the database for Grafana. You can also run it locally, without an external database. Then, Grafana uses an SQLite DB. But the Postgres database made more sense to me. This was the first deployment of a production database with CloudNativePG and looked like this:
apiVersion: postgresql.cnpg.io/v1
kind: Cluster
metadata:
  name: grafana-pg-cluster
  labels:
    homelab/part-of: grafana
spec:
  instances: 2
  imageName: "ghcr.io/cloudnative-pg/postgresql:16.2-10"
  bootstrap:
    initdb:
      database: grafana
      owner: grafana
  resources:
    requests:
      memory: 100M
      cpu: 100m
  postgresql:
    parameters:
      max_connections: "20"
      shared_buffers: "25MB"
      effective_cache_size: "75MB"
      maintenance_work_mem: "6400kB"
      checkpoint_completion_target: "0.9"
      wal_buffers: "768kB"
      default_statistics_target: "100"
      random_page_cost: "1.1"
      effective_io_concurrency: "300"
      work_mem: "640kB"
      huge_pages: "off"
      max_wal_size: "128MB"
  storage:
    size: 1G
    storageClass: rbd-fast
  backup:
    barmanObjectStore:
      endpointURL: http://rook-ceph-rgw-rgw-bulk.rook-cluster.svc:80
      destinationPath: "s3://backup-cnpg/"
      s3Credentials:
        accessKeyId:
          name: rook-ceph-object-user-rgw-bulk-backup-example-user
          key: AccessKey
        secretAccessKey:
          name: rook-ceph-object-user-rgw-bulk-backup-example-user
          key: SecretKey
    retentionPolicy: "30d"
As before, I determined the spec.postgresql.parameters by plugging my requirements
into PGtune. One important piece is the
storage.size config. I got that value wrong in the beginning, setting it to
only 256 MB. More details can be found in this post.
I also configured backups via my Ceph Rook cluster and had to create an S3 bucket user like this:
apiVersion: ceph.rook.io/v1
kind: CephObjectStoreUser
metadata:
  name: backup-example-user
spec:
  store: rgw-bulk
  clusterNamespace: rook-cluster
  displayName: "Backup user for Grafana DB"
I also configured scheduled backups for the database:
apiVersion: postgresql.cnpg.io/v1
kind: ScheduledBackup
metadata:
  name: grafana-pg-backup
spec:
  method: barmanObjectStore
  immediate: true
  schedule: "0 30 1 * * *"
  backupOwnerReference: self
  cluster:
    name: grafana-pg-cluster
And finally, the CloudNativePG operator needs access to the Postgres pods when using NetworkPolicies:
apiVersion: "cilium.io/v2"
kind: CiliumNetworkPolicy
metadata:
  name: "grafana-pg-cluster-allow-operator-ingress"
spec:
  endpointSelector:
    matchLabels:
      cnpg.io/cluster: grafana-pg-cluster
  ingress:
    - fromEndpoints:
      - matchLabels:
          io.kubernetes.pod.namespace: cnpg-operator
          app.kubernetes.io/name: cloudnative-pg
With the database finally up and running, and all the kinks worked out, I could deploy Grafana itself.
Grafana setup
Before beginning the Grafana setup itself, I had to go over to Keycloak to add a new client, as I was changing the Grafana URL as part of the migration. The Grafana doc has a good example for setting up OIDC here, so I won’t go into details.
To supply the OIDC secret and client name to the Grafana deployment, I stored them in my HashiCorp Vault instance and grabbed them from there via external-secrets:
apiVersion: external-secrets.io/v1beta1
kind: ExternalSecret
metadata:
  name: "grafana-oauth2-keycloak"
  labels:
    homelab/part-of: monitoring
spec:
  secretStoreRef:
    name: my-vault-store
    kind: ClusterSecretStore
  refreshInterval: "1h"
  target:
    creationPolicy: 'Owner'
    template:
      metadata:
        labels:
          homelab/part-of: monitoring
      data:
        secret: "{{ .secret }}"
        client: "{{ .client }}"
  dataFrom:
    - extract:
        key: secret/my_kubernetes_secrets/cluster/grafana-oauth2-secrets
On to the main event. As noted above, I’m deploying the Grafana Helm chart as a subchart of the kube-prometheus-stack chart, which I used previously to provide Prometheus already:
grafana:
  enabled: true
  defaultDashboardsTimezone: Europe/Berlin
  defaultDashboardsEditable: false
  sidecar:
    datasources:
      alertmanager:
        enabled: false
  testFramework:
    enabled: false
  extraLabels:
    homelab/part-of: grafana
  serviceMonitor:
    enabled: false
  ingress:
    enabled: true
    annotations:
      traefik.ingress.kubernetes.io/router.entrypoints: secureweb
    hosts:
      - grafana.example.com
  resources:
    requests:
      cpu: 250m
      memory: 256M
  persistence:
    enabled: false
  admin:
    existingSecret: "admin-secret-name"
    userKey: user
    passwordKey: password
  extraSecretMounts:
    - name: oidc-secret
      secretName: grafana-oauth2-keycloak
      mountPath: /secrets/oauth-keycloak
      readOnly: true
    - name: db-secret
      secretName: grafana-pg-cluster-app
      mountPath: /secrets/my-db
      readOnly: true
  datasources:
    datasource.yaml:
      apiVersion: 1
      editable: false
      datasources:
        - name: loki-k8s
          type: loki
          access: proxy
          url: http://loki.loki.svc.cluster.local:3100
          isDefault: false
  grafana.ini:
    analytics:
      check_for_updates: false
    server:
      root_url: https://grafana.example.com
    database:
      type: postgres
      host: "$__file{/secrets/my-db/host}:$__file{/secrets/my-db/port}"
      name: "$__file{/secrets/my-db/dbname}"
      user: "$__file{/secrets/my-db/user}"
      password: "$__file{/secrets/my-db/password}"
    users:
      allow_sign_up: false
    log:
      level: info
    log.console:
      format: json
    alerting:
      enabled: false
    auth.generic_oauth:
      enabled: true
      name: Keycloak
      allow_sign_up: false
      skip_org_role_sync: true
      client_id: "$__file{/secrets/oauth-keycloak/client}"
      client_secret: "$__file{/secrets/oauth-keycloak/secret}"
      scopes: openid email profile offline_access roles
      email_attribute_path: email
      login_attribute_path: username
      name_attribute_path: full_name
      auth_url: https://keycloak.example.com/realms/my-realm/protocol/openid-connect/auth
      token_url: https://keycloak.example.com/realms/my-realm/protocol/openid-connect/token
      api_url: https://keycloak.example.com/realms/my-realm/protocol/openid-connect/userinfo
      role_attribute_path: contains(roles[*], 'admin') && 'Admin' || contains(roles[*], 'editor') && 'Editor' || 'Viewer'
Let’s start with an obvious one: I’m yet again disabling alerting and Grafana’s own ServiceMonitor, because I did not want to get bogged down even more in staring at pretty plots all evening long. 😅 I’ve got the persistence disabled, because I’m using a Postgres database. Be cautious with this - if persistence is disabled and you don’t configure an external database, your Grafana config and dashboards won’t survive a Pod restart!
Next, let’s look at the admin config. I went with an existing secret here, to
not have to put a password into the Helm chart directly. This password is important,
because it’s not just Grafana’s initial password, but it’s also used by Grafana’s
Provisioning functionality,
for API access. There is also a formatting issue somewhere with the password. If
it contains special characters, you will run into issues with not being able to
log in as the admin, and the dashboard and data source provisioning containers
failing to do their job because they also can’t log in. I’m not sure which
particular special character Grafana did not like, but logins failed consistently
with my completely randomly generated 100 character password. Switching to a
purely alphanumeric one fixed the issue.
One would think we would have gotten past the “Escaping strings is hard!!!” phase of computing by now. 🙄
I will got into the datasources config a bit later when I talk about Grafan’s
provisioning capability.
Grafana config
Now let’s have a look at the Grafana config. The first thing to note is the
$__file{<FILEPATH>} syntax. This is a pretty nice Grafana feature. Instead of
having to write things into environment variables, Grafana can read values for
its config from other files. I’m using
that for the Postgres database config as well as the OIDC secrets from Keycloak.
When defining a secret to mount, Kubernetes will create one file per property
under the data: key in the secret. My database secret, automatically generated
by CloudNativePG, looks something like this:
data:
  dbname: grafana
  host: grafana-pg-cluster-rw
  jdbc-uri: jdbc:postgresql://grafana-pg-cluster-rw:5432/grafana?password=foo&user=grafana
  password: foo
  pgpass: [...]
  port: 5432
  uri: postgresql://grafana:foo@grafana-pg-cluster-rw:5432/grafana
  user: grafana
  username: grafana
This means that under /secrets/my-db/, where I mounted the secret, I will have
files like dbname, password or uri, which I can then use with the $__file
syntax to put them into Grafans’s config file.
One note on the uri which CloudNativePG provides and Grafana generally supports
instead of setting all the options separately: Sadly, the URI as provided by
CloudNativePG gives the DB type as postgresql, but Grafana expects the name to
be postgres instead, spitting out the following error message:
Error: ✗ failed to connect to database: unknown database type: postgresql
So I had to switch to providing the individual config options, which also worked nicely.
The last interesting thing to note about the config is the grafana.ini.auth.generic_oauth.allow_sign_up
option. This needs to be set to true for your first login with your Keycloak
user, so that Grafana can create the user. After that, it can be disabled.
Grafana provisioning
Grafana’s provisioning functionality was something I hadn’t heard about at all before this migration. In short, instead of defining data sources and dashboards manually via the UI, you can provide YAML files in a specific format in a specific directory or call the Grafana API to create them.
I’m currently only making use of this in my own config to add my Loki data source:
  datasources:
    datasource.yaml:
      apiVersion: 1
      editable: false
      datasources:
        - name: loki-k8s
          type: loki
          access: proxy
          url: http://loki.loki.svc.cluster.local:3100
          isDefault: false
This will add the loki-k8s data source, with the given URL. The access config
configures how the data is fetched. proxy configures it so that Grafana fetches
the data, while the alternative direct will have your browser fetch the data.
The same functionality is also used by the kube-prometheus-stack chart to add
the Prometheus instance as a source automatically.
Similarly, dashboards can also be defined in this way. I initially thought that I would add all my own dashboards this way as well. But then I decided not to. The reason is in the nature of dashboards, especially when compared to data sources: I will be changing dashboards relatively often, and might just make occasional, spur of the moment changes. When there’s a dashboard which is supplied via provisioning, Grafana will always override the version from the database with the provisioned version. That means, whenever I do a change, I would need to export the dashboard and put it under version control. That seemed just a bit too much hassle.
The difference I see to data sources is that with dashboards, I will only ever change them in the UI. Editing the text version by hand just isn’t an option. In contrast, I don’t have to see what they look like or extensively test data sources. I define them once, and then they will remain untouched until the next big Homelab migration. But perhaps Grafana will come up with a good UX to push UI changes back to provisioned dashboards. I would use it in a heartbeat.
One place where provisioned dashboards are pretty nice is when other Helm charts bring their own dashboards out of the box, like kube-prometheus-stack does.
Migrating the dashboards
After the new Grafana instance was finally up and running, I started migrating
over my dashboards. The first one I did was the Ceph dashboard. At the same time,
I enabled metrics gathering for my Rook cluster. Enabling metrics was as simple
as adding the following to the values.yaml file for the Cluster chart (not the
operator chart!):
monitoring:
  enabled: true
This will enable the required MGR module and set up a Prometheus operator
ServiceMonitor. I initially had problems with actually getting Prometheus to
recognize the new ServiceMonitor, because I had not properly configured the
Namespaces where it looks for them. I fixed this by adding the following option
to the prometheus.prometheusSpec map in the values.yaml file for the
kube-prometheus-stack chart:
serviceMonitorSelectorNilUsesHelmValues: false
By default, Prometheus only checks the Namespace where it is deployed. This option configures it so it looks in all namespaces, unless you have explicitly configured a list of Namespaces to check in the chart.
The next issue I observed, still on my old instance, was that the Ceph dashboard I was using, a fork of this dashboard was not handling multiple clusters well. This became an issue because I was now gathering metrics from my baremetal and from my Rook cluster.
I worked around this by making use of Grafana’s Variables.
I chose the Custom type of variable, and added the following two values:
job="ceph-metrics",job!="ceph-metrics"
My old baremetal cluster’s scrape job was called ceph-metrics, and the Ceph
metrics themselves sadly don’t come with per-cluster labels.
Let’s take a simple Stat panel showing the health of the cluster with this query:
sum without (instance) (ceph_health_status{${cluster}})
Now with my little workaround, the ${cluster} variable will either contain
job="ceph-metrics" or job!="ceph-metrics", cleanly separating the data for
my clusters.
One further change I had to make was to change the labels to be ignored in all
the aggregation queries specifically for the Rook cluster’s data, because besides
the typical Ceph metrics, it also added the Pod name to some of them, for example
the ceph_osd_op_r_out_bytes metric. So for getting the current read rate for
my OSDs, I would then use this query:
sum without (ceph_daemon, instance, pod) (irate(ceph_osd_op_r_out_bytes{${cluster}}[5m]))
The addition here was the pod in the without list.
With that bit of preface out of the way, let’s look at the actual dashboard migration. I opted to go for exporting the dashboard to a local file on my desktop from the old Grafana and then importing it into the new Grafana.
To export a dashboard, you can use the “Share” button in the upper right of each dashboard, next to the “Save” and “Config” buttons:
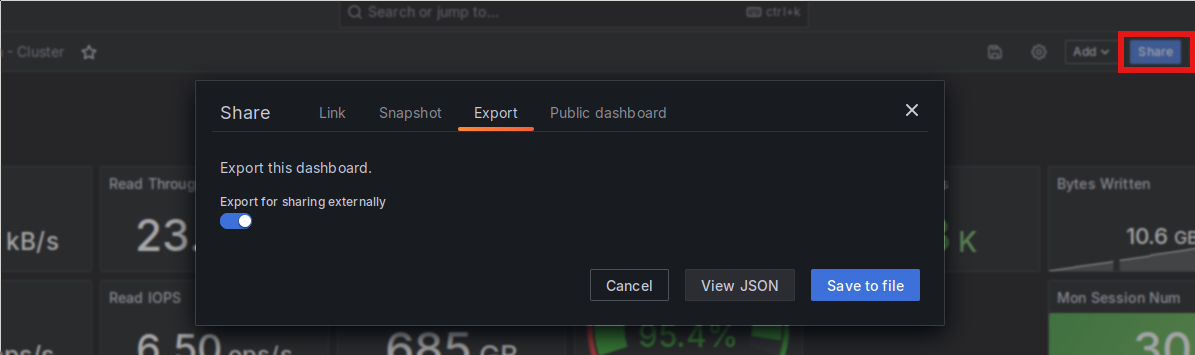
Grafana’s dashboard export UI.
When exporting dashboards for use in another Grafana instance, it is important to check the “Export for sharing externally” button. With that, library panels used in the dashboard are also exported as part of the dashboard.
After being stored in a file, the import is similarly simple. After loading the
JSON file previously exported via Grafana’s dashboard import, which is shown as
an option when adding a new dashboard, your are presented with this form: Grafana’s dashboard import UI.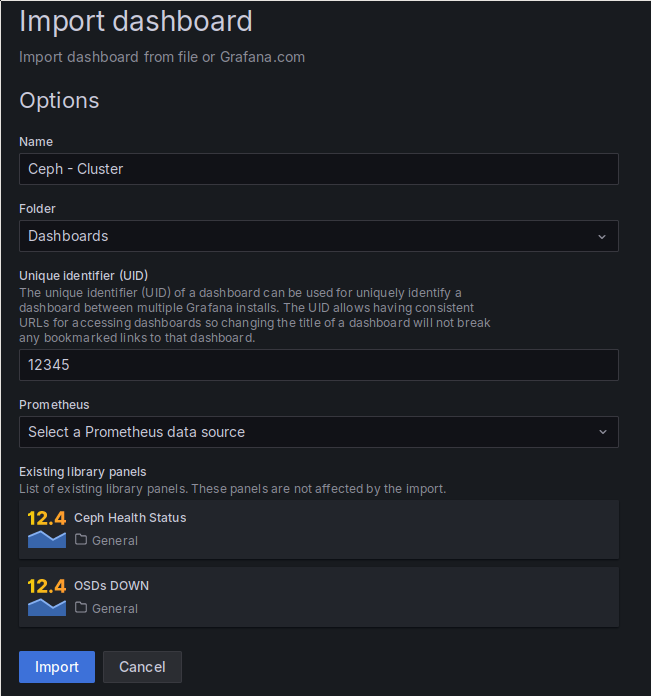
The above import form allows you to set the name, the UID and the folder where an imported dashboard is placed. Because I chose the “Export for sharing externally” option, the import also contains two library panels I have in the dashboard. Finally, you also get to chose the Prometheus data source to be used, as the exported dashboard contains placeholders instead of actual IDs for the data source.
This worked pretty well, including the import of the library panels, but I still hit an error, specifically with those library panels. For some reason, the data source placeholder was not properly replaced during the import, and I got the following error message on the two library panels:
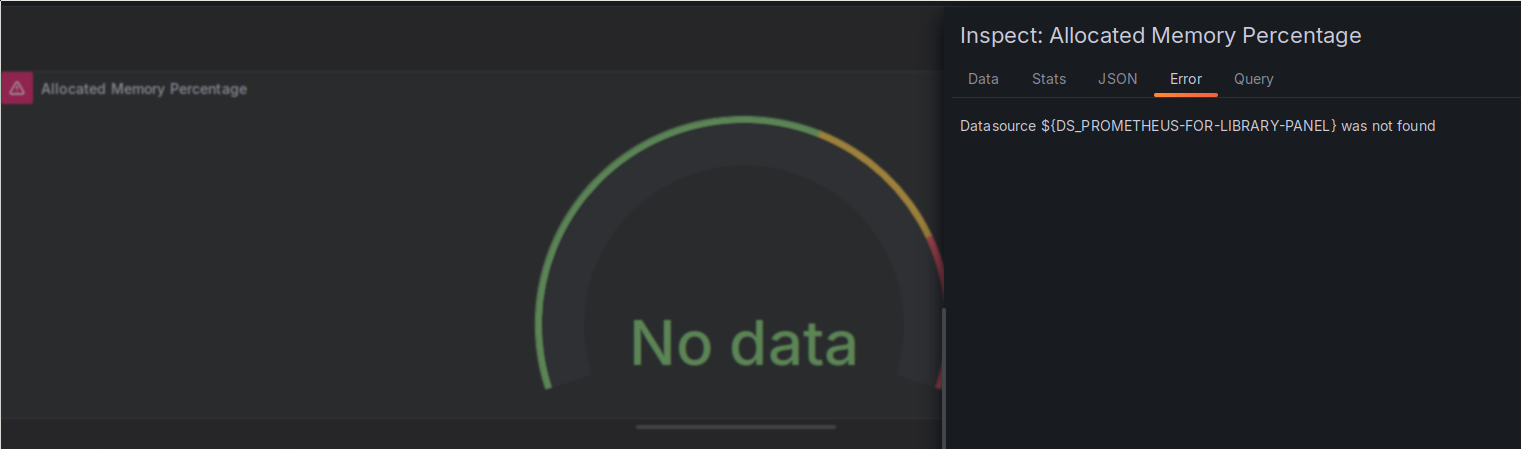
Error on imported library panels.
I was not able to figure out why I was seeing this error. All of the non-library panels in this dashboard, as well as all the other dashboards I imported, worked fine, while all the library panels showed this same error.
I ended up fixing it by going to the “JSON” tab and manually replacing the
${DS_PROMETHEUS-FOR-LIBRARY-PANEL} placeholder with the name of my Prometheus
data source.
Conclusion
This post finally concludes the migration of my metrics stack over to my Kubernetes cluster. Besides that I now also have proper data gathering for the Kubernetes and Rook clusters. More pretty graphs for me. 🤓
This part of the migration took way longer than previous parts. I make my return to gaming, and specifically returning to Stellaris, partially responsible for that. 😁
The next step should hopefully go a bit faster: I will have a look at Harbor for both, my own image storage as well as using it as a pull-through cache.