Wherein I talk about a small tool for access log analysis on the terminal.
I recently re-discovered a small tool I already came across a while ago, but never wrote a post about: Goaccess. It’s a command line tool which can be used to do quick analysis of web server access logs. It understands some of the standard formats from e.g. Apache out of the box, but also provides facilities to parse other log formats. In this post, I will use it to parse 30 GB worth of logs from my public-facing Traefik instance and see what I can get out of it.
The first step was getting the Traefik logs. While I do also have them in my Loki instance, those are only the ones from the last year. But it turns out that I never deleted the logs on the host. 🤦 Luckily it has a large enough disk. I ended up with 30 GB of logs, ranging from March 2023 to December 2025.
Before showing you the results, one weird thing while copying the file to my laptop: It was incredibly slow. Sure, it was 30 GB worth of logs, but I was sitting behind a 1 Gbps connection. And with my upload at home, it was only coming down the pipe with a bit over 5 MB/s. I tried to figure out why. No internal network connection in the Homelab was overloaded. Neither was the CPU of the Pi I was copying the file from. And only just now, as I’m typing this, am I realizing that it’s not some SSH/rsync inefficiency or the slow Pi 4 CPU. No, it’s of course my network connection back home. That’s not a 1 Gbps, but rather 250 Mbps down and - you probably guessed it already - 40 Mbps up. 🤦 So absolutely nothing wrong with that at all. I was just being a bit thick for a moment there.
The first issue I had was how to parse the logs, as I had configured JSON output for my Traefik instance, and all the pre-configured log formats are standard line formats, not JSON. But after a bit of googling, I came across this GitHub issue, more specifically, this comment. It showed how to set up goaccess’ log-format option to work with Traefik’s JSON output format. Here’s an example log line:
2023-03-02T22:22:07.136593921+01:00 stdout F {
    "ClientAddr":"10.88.0.1:55130",
    "ClientHost":"10.88.0.1",
    "ClientPort":"55130",
    "ClientUsername":"-",
    "DownstreamContentSize":19,
    "DownstreamStatus":404,
    "Duration":149256,
    "Overhead":149256,
    "RequestAddr":"127.0.0.1:443",
    "RequestContentSize":0,
    "RequestCount":1,
    "RequestHost":"127.0.0.1",
    "RequestMethod":"GET",
    "RequestPath":"/",
    "RequestPort":"443",
    "RequestProtocol":"HTTP/1.1",
    "RequestScheme":"http",
    "RetryAttempts":0,
    "StartLocal":"2023-03-02T22:22:07.136056394+01:00",
    "StartUTC":"2023-03-02T21:22:07.136056394Z",
    "level":"info",
    "msg":"",
    "request_User-Agent":"curl/7.81.0",
    "time":"2023-03-02T22:22:07+01:00"
}
The first issue to solve was the prefix added by Podman because that’s where the Traefik server is running. Another is that the log is mixed, so it doesn’t just contain access log lines like the above, but also other messages from Traefik. I’m working with the following to get only the access logs:
grep -a "ClientAddr" traefik.log | cut -d ' ' -f4- > cleaned.log
Here, traefik.log is the original log file. I’m filtering for lines with ClientAddr,
which will be the access logs. And I’m taking only the fourth field, to only get
the actual access log, not Podman’s prefix. The - at the end of -f4- is
load bearing. It is needed so that it stops splitting the line by the given
delimiter and outputs the whole rest of the line starting with field 4. Without
this, user agent strings with spaces in them will be cut off, so that the
access log part of the line will be incomplete, lacking the final time member
and the closing brace.
With that done, here is the command for analyzing the resulting logs with goaccess:
goaccess --jobs 8 --log-format='{"ClientHost": "%h", "ClientUsername": "%e", "DownstreamContentSize": "%b", "DownstreamStatus": "%s", "Duration": "%n", "RequestHost": "%v", "RequestMethod": "%m", "RequestPath": "%U", "RequestProtocol": "%H", "request_Referer":"%R", "request_User-Agent":"%u", "time": "%dT%t"}' --date-format='%Y-%m-%d' --time-format='%T%z' cleaned.log
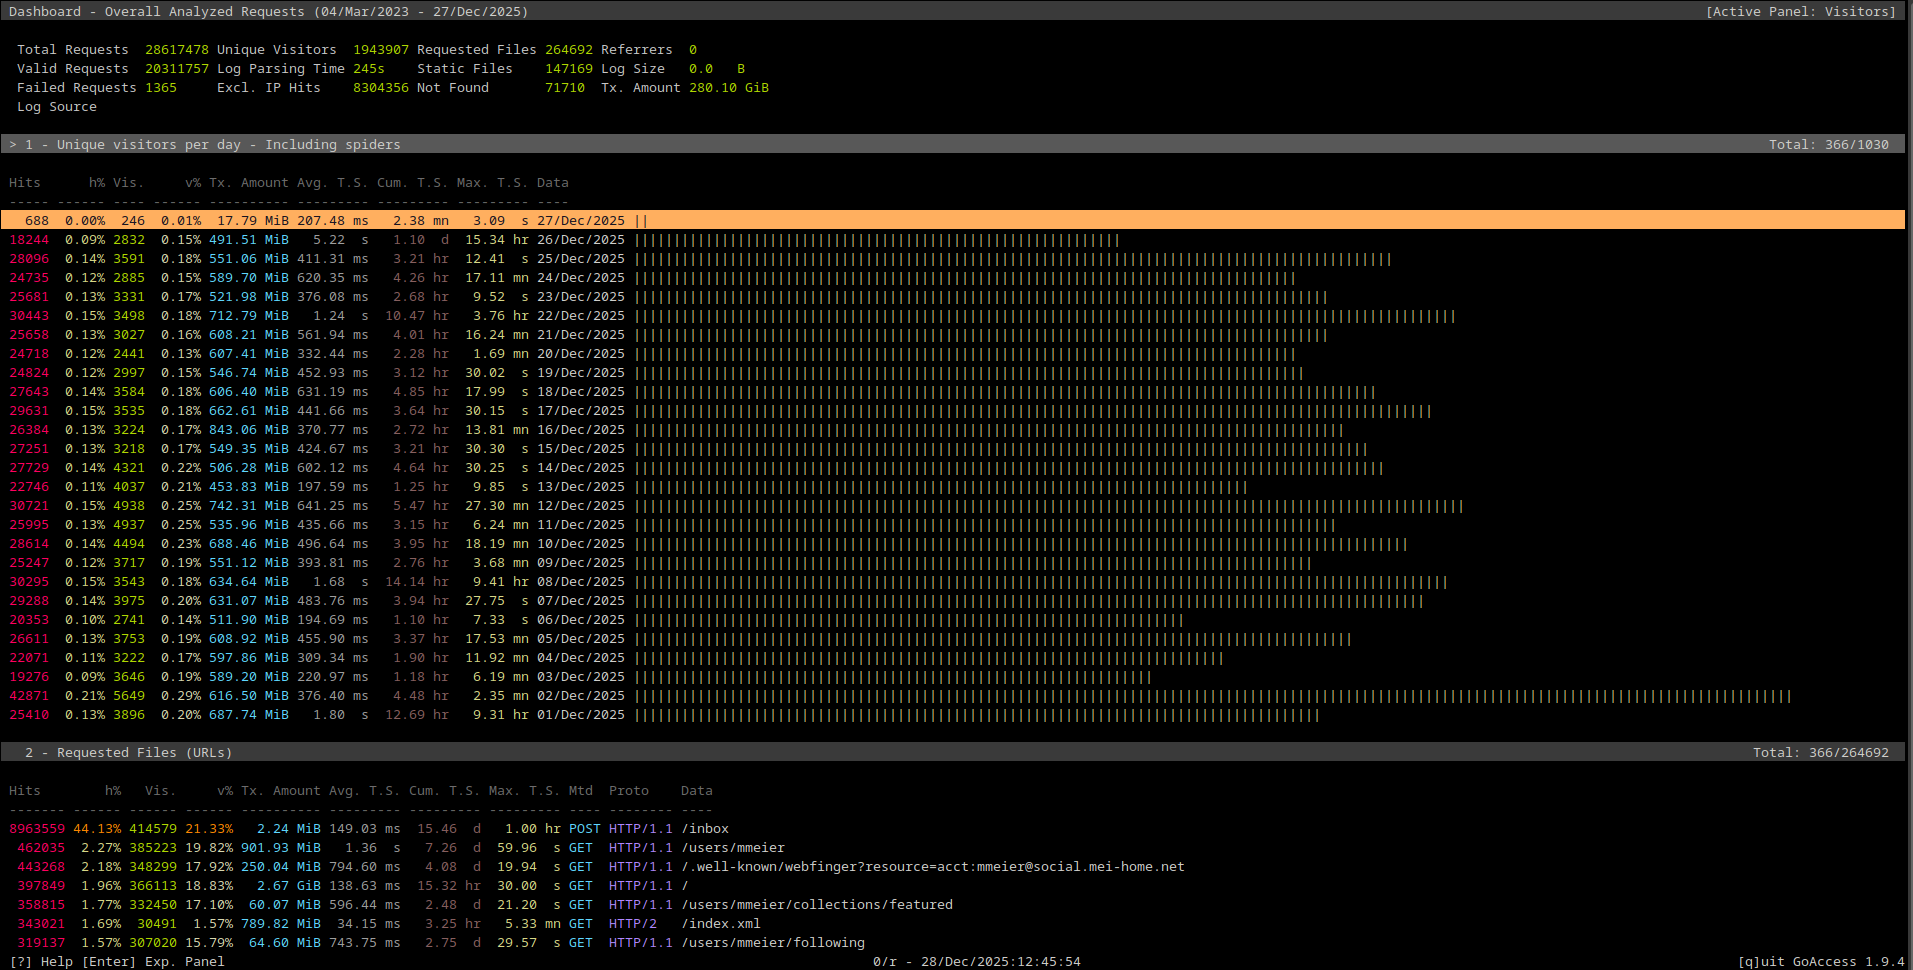
Running that command will analyze the log file in its entirety and then show goaccess’ ncurses UI:

Top of the goaccess ncurses UI
The next page looks like this: The next set of sections in the goaccess UI.
And finally, here is the final set of tables: The final set of sections in the UI.
In the above screenshot, the “Referring Sites” table is entirely empty, as I’m not logging any referrers.
In addition to the ability of showing an interactive ncurses interface like this,
goaccess also has the ability to generate an HTML version of the analysis, which
looks like this: The HTML variant of the report. The main difference is that the HTML version is able to show charts in addition to tables.
There’s one more feature before I’d like to get to my own data: Storing and re-using
results. Although to be honest, I’m not really sure how useful it is. With this
feature, the preprocessed data can be stored on disk, so that the next invocation
of goaccess doesn’t need to parse all of the logs again. On my laptop, running a
8 core AMD Ryzen 4900HS, with the “-j 8” option I showed above, takes about
250 seconds to churn through 28 million requests in a 30 GB log file. To store
the data in a database, append --persist --db-path /some/dir to the goaccess
invocation. This will store the analyzed data. It can then be re-used with a
command like this:
goaccess --jobs 8 --log-format='{"ClientHost": "%h", "ClientUsername": "%e", "DownstreamContentSize": "%b", "DownstreamStatus": "%s", "Duration": "%n", "RequestHost": "%v", "RequestMethod": "%m", "RequestPath": "%U", "RequestProtocol": "%H", "request_Referer":"%R", "request_User-Agent":"%u", "time": "%dT%t"}' --date-format='%Y-%m-%d' --time-format='%T%z' --db-path /some/path --restore
Initially, I was missing the - at the end of the cut -d ' ' -f4- part of my
extraction command, which lead to the JSON logs being cut off due to spaces in
the user agent string. The result was that the overwhelming majority of logs were
rejected by goaccess. To analyze the issue, you can add the option --invalid-requests=./invalid.log
to the command. All rejected log lines will be written into that file.
And finally, I would advise working with the commands as I’ve given them here, first filtering the log lines, writing them into a new file and then providing that file to the goaccess invocation. Do not do this:
grep -a "ClientAddr" traefik.log | cut -d ' ' -f4- > cleaned.log | goaccess...
I found that this is rather slow, when compared to providing a pre-filtered file.
Analyzing my data a bit
With the tool’s basic functionality out of the way, let’s have a closer look at my data. For a bit of context, the Traefik instance this data is coming from is not my Kubernetes Ingress Controller instance. Instead, this is the instance fronting external access. Everything that comes in from the public internet goes through this Traefik instance, running on a mostly firewalled-off Pi. There’s still some internal traffic going through there as well though, as I’m also pointing the internal DNS for those publicly visible services to this “bastion” Traefik instance instead of the k8s Ingress. I mostly do this to have an easy way to make sure my public facing stuff actually works.
I created the data from a Traefik JSON log file pre-filtered to contain only the access logs like this:
goaccess --jobs 12 --log-format='{"ClientHost": "%h", "ClientUsername": "%e", "DownstreamContentSize": "%b", "DownstreamStatus": "%s", "Duration": "%n", "RequestHost": "%v", "RequestMethod": "%m", "RequestPath": "%U", "RequestProtocol": "%H", "request_Referer":"%R", "request_User-Agent":"%u", "time": "%dT%t"}' --date-format='%Y-%m-%d' --time-format='%T%z' --invalid-requests=./invalid.log --unknowns-log=./unknowns.log -e 10.0.0.0-10.255.255.255 -r
The change in the --jobs value comes from the fact that I’m back home now and
on my beefier desktop machine. I’m also providing two additional files for goaccess
to write problematic logs to. The --invalid-requests option directs log lines
which goaccess couldn’t parse to a separate file. The --unknowns-log redirects
unknown user agents into a separate file. In my case, those are mostly Prometheus
and Uptime-Kuma, as well as Gatus and a number of Fediverse servers.
Finally, I’m also excluding my local IP range, with -e 10.0.0.0-10.255.255.255.
That’s because for this analysis, I was only interested in external traffic.
The finished analysis shows a total of 28 million requests, ranging from 2023-03-04 to 2025-12-27. About eight million of those are for local access, so they got excluded from the rest of the analysis. Only 1469 logs were unparsable.
Here is the table by visitors, which goaccess computes with combination of user agent and source IP:
| Visitors | Percentage of Total Visitors | Requests | Transferred Data | Day |
|---|---|---|---|---|
| 7746 | 0.40% | 30492 | 257 MiB | 2025-11-22 |
| 7483 | 0.38% | 26523 | 388 MiB | 2025-11-27 |
| 7162 | 0.37% | 27083 | 240 MiB | 2025-11-21 |
| 7126 | 0.37% | 26839 | 283 MiB | 2025-11-26 |
| 7081 | 0.36% | 46890 | 442 MiB | 2025-10-05 |
| 6550 | 0.34% | 26169 | 356 MiB | 2025-11-20 |
| 5649 | 0.29% | 42871 | 616 MiB | 2025-12-02 |
So there’s a lot more hits coming per visitor, which makes sense: The data does contain both my blog and my Mastodon instance. And the Mastodon instance likely has relatively few visitors, but a lot of requests. Overall, there also doesn’t seem to be that much variation, at least not at the top. What is interesting in this table is the variation in the transmitted amount of data. I would have expected that to be relatively stable day-to-day, with perhaps a bit more traffic on days where I post a few screenshots of Grafana graphs, or a particularly chart-heavy blog post? I tried to figure out what I might have done on 2025-12-02, but I neither posted a picture on Mastodon nor a blog post.
Sorting that section by the TX data, 2025-05-01 is at the top, with over 30 GiB transferred. I grepped for “2025-05-01” in the log and then piped the result into goaccess again, and that was the day I switched my k8s control plane nodes to Pi 5, and posted a few pictures on Mastodon. Specifically, this thread.
Next up, requested files/URLs, sorted by number of hits:
| Hits | Percentage of Total Hits | Transmitted Data | URL |
|---|---|---|---|
| 8963559 | 44.13% | 2 MiB | /inbox |
| 462035 | 2.27% | 901 MiB | /user/mmeier |
| 443268 | 2.18% | 250 MiB | /.well-known/webfinger?resource=acct:mmeier@social.mei-home.net |
| 397849 | 1.96% | 2670 MiB | / |
| 358815 | 1.77% | 60 MiB | /users/mmeier/collections/featured |
| 343021 | 1.57% | 789 MiB | /index.xml |
| 319137 | 1.57% | 64 MiB | /users/mmeier/following |
Those are obviously dominated by my Mastodon instance, with POST requests to
the inbox accounting for almost half of all requests which reached my Homelab
from external sources. The only non-Mastodon URLs are the index.xml, which is
from my blog, and possibly /. But the / might be either Mastodon or the blog.
I’m also assuming that the /index.xml will likely dominate in the future, as
I switched to providing full text in my RSS feed a little while ago.
Next is a specific section for 404’s, but that’s not too interesting, because it’s just a lot of Mastodon API data endpoints, and I disabled those.
Then come the visitor’s IPs. I won’t post the entire table, as it’s not too
useful I think, but there was something worth mentioning: Over the entire
timeframe, a whole 8.83% of requests came from one IP, 38.242.251.94. I first
thought that’s a crawler of some sort, but it turns out that that’s a Fediverse
instance. Specifically, the PeerTube instance tilvids.com.
Filtering only for that URL, 99% of requests are for /inbox. I got curious and
started asking around whether PeerTube instances are particularly talkative.
Because I’m following only a few channels on that instance, which don’t post
that much. But it’s still showing up a lot more than e.g. mastodon.social, where
I’m following a lot more people.
Sadly, at the time of writing, there were no responses. I can only assume that
PeerTube sends out a lot more requests, even if nobody on the instance would
ever receive them.
Next are the operating systems and browsers. I’m genuinely unsure how interesting these are, considering that some bots like to lie. And goaccess doesn’t do any deep analysis, it just looks at the access log line’s User Agent string.
| Hits | Percentage of Total Hits | Operating System |
|---|---|---|
| 14734214 | 72% | Crawlers |
| 2602332 | 12% | Unknown |
| 848514 | 5% | Windows |
| 720961 | 3% | Android |
| 211467 | 1% | Linux |
| 163847 | 0.81% | macOS |
| 26675 | 0.45% | iOS |
So it’s clear that my Homelab mostly exists for the benefit of crawlers. 😉 What I did find a bit surprising was that Linux is so far down, considering that the majority of people arriving at my proxy have to be coming for the blog. While the Crawlers category will also contain stuff like Fediverse servers, my blog is the only other interesting, externally accessible service. And considering that that’s mostly really nerdy Homelab content, I would have thought that the percentage of Linux users would be higher. It is of course possible that bots which mask as normal users tend to use Windows instead of Linux?
The last interesting stat overall is the actual domains getting hit:
| Hits | Percentage of Total Hits | Domain |
|---|---|---|
| 16862714 | 73% | social.mei-home.net |
| 1690065 | 34% | blog.mei-home.net |
| 633110 | 3% | bookwyrm.mei-home.net |
| 453558 | 2% | cloud.mei-home.net |
| 425668 | 2% | s3-mastodon.mei-home.net |
| 42625 | 0.2% | mei-home.net |
| 41970 | 0.2% | s3-bookwyrm.mei-home.net |
Nothing really surprising here. Most of the traffic comes from my Mastodon instance. What is a bit surprising is that the blog is still responsible for 34% of the requests. I don’t think I’ve got that many readers, especially compared to the amount of traffic my Mastodon instance produces. Perhaps it’s all the RSS feed readers everyone self-hosts?
So much for describing the goaccess tool a bit and looking at the data from the last three years for my Homelab’s ingress. This taught me two things:
- I really want to get a move on and introduce some sort of metrics gathering for my blog
- I really should introduce log rotation for the Traefik logs on my bastion host 😅