I’ve had problems with the stability of my Kubernetes control plane ever since I migrated it to three Raspberry Pi 4 from their temporary home on a beefy x86 server. I will be going into more detail about the problem first, describe the Pi 5 with NVMe a bit, and then describe the migration itself.
The problem
I’ve noted in a couple of the last posts that I’ve started seeing instability in my Kubernetes control plane. The main symptom I saw were my HashiCorp Vault Pods going down regularly. This was pretty visible because I have not automated unsealing for Vault, so each time the Pods are restarted, I have to manually enter the unseal passphrase.
But looking closer at the nodes, all three Raspberry Pi 4 4GB showed a very high number of restarts for all of their Pods:
- kube-vip, which I use to provide a virtual IP for the k8s API
- kube-apiserver
- kube-scheduler
- kube-controller-manager
- Ceph MON
The only component which wasn’t regularly restarted was etcd. I tried to dig really deeply into the issue, but was never able to figure out what really triggered the restarts. There were a lot of timeouts in the logs of etcd, kube-apiserver and kube-vip. There are also some really long multi-minute periods where the etcd cluster is unable to elect a new leader because they think they’re in different terms. In the end it all always seems to heal itself, I never needed to manually interfere to get the cluster back. But it didn’t look good.
The following two plots illustrate this by showing the apiserver_request_aborts_total
and the etcd_request_errors_total metrics for the period where the Pi 4 were
running the control plane. Both metrics show the rate, summed up over all
label values.
Here is the Rate of etcd request errors per second. I finished the migration of the control plane to the Pi 4 around 00:00 on April 13th. I migrated to the Pi 5 on May 1st.etcd_request_errors_total metric:
While the error rate is not that high, it’s pretty clear that it started after I migrated the control plane to the Pi 4 around April 12th, and vanished completely after I migrated to the Pi 5. That large spike on May 1st was when I accidentally bumped the USB-to-SATA adapter of one of the Pi 4 nodes while another one was already down for replacement. The single remaining Pi 4 did not take that very well. 😅
Here is a slightly different view of the aborted apiserver requests during the
same period: Rate of apiserver request errors per second. I finished the migration of the control plane to the Pi 4 around 00:00 on April 13th. I migrated to the Pi 5 on May 1st.
These two plots already show pretty conclusively that something was wrong after
I migrated the control plane to the Pi 4. And that the migration to the Pi 5
fixed the issue. Here is a final plot, showing the container restarts for the
kube-apiserver, kube-scheduler, kube-controller-manager and Vault: The increase in container restarts over the past hour.
It’s clear here that the problem was not persistent - there were several days where no restart at all happened. But the problem was definitely there. One major problem was that I couldn’t really figure out what triggered the restart. I spend several hours looking at the logs on the control plane hosts, but wasn’t able to identify the real culprit. It looked like at some point etcd just got overwhelmed, which made both the local apiserver and then finally the kubelet error out, leading to a round of container restarts.
There were also no clear indications in the machine’s metrics. The only thing I found was some increased IOWAIT time on the CPUs, but at the same time it didn’t look like the IO was actually overwhelmed.
I ended up with the conclusion that I was asking just a bit too much of the poor Pi 4, and decided that this was the right moment to look at the Pi 5 and its NVMe-capable PCIe connection.
The Raspberry Pi 5
When looking for a replacement for the three Raspberry Pi 4, it was pretty clear that I would be going with the new Pi 5. Most of my Homelab already consists of Pis, and at least the Pis are supported by an array of mainstream Linux distros instead of empty promises. The main new feature of the Pi 5 for me is the fact that it now provides an interface to a PCIe Gen2 x1 lane by default. This lane can be updated to Gen3, but that’s currently not officially supported. With this PCIe lane comes the ability to connect to an NVMe SSD and even booting off of it. As I suspected that part of my problem with the Pi 4 control plane nodes was IO, this made me hopeful that a Pi 5 would be able to cope.
I also made the decision of buying the Pi 5 in the 8 GB variant, as opposed to the 4 GB variant Pi 4 forming my control plane before. I don’t really see a need for the increased RAM right now, there was still plenty of free RAM on the 4 GB models. But I wanted to invest in a bit of future proving here.
For the cooling I wanted to go passive again. I had some very bad experience with a Pi 4 case with an active fan when it was still said that the Pi 4 needed active cooling, shortly after release. And with my rack sitting right next to my desk, I want quiet. I bought this case. It’s very similar to the passive heat sinks I’ve been using for the Pi 4.
All the article links in this post will go to berrybase.de, as that was where I bought the equipment. It’s mostly in German, but I’m reasonably sure that you could find the same stuff in many other places.
With cooling covered, I next went hunting for a way to fasten the SSD. A traditional Pi HAT was off the table, due to the use of the large heat sink. But after some searching, I found some good reviews of Pimoroni’s NVMe base. Pimoroni is a pretty trustworthy brand, and they provided some compatibility info on their page. Plus, they were available in the berrybase shop.
I then had a closer look at Pimoroni’s compatibility section for NVMe SSDs, and finally settled on the Kioxia Exceria G2. It was on the compatibility list, was relatively affordable, from a trusted brand and available at my trusted IT hardware retailer. I bought four of them, three 500 GB models for the new control plane and one 1 TB model, for some future experiments.
Last but not least, I also had to buy a couple of mounting plates for my Racknex Pi rack mount.
Overall, this is what one of the new Pis cost me:
| Item | Cost |
|---|---|
| Raspberry Pi 5 8 GB | €84,90 |
| Armor Heat Sink | €9,90 |
| Power Supply | €12,40 |
| NVMe Base | €16,50 |
| 500 GB Kioxia NVMe SSD | €32,90 |
| Mounting Plate | €10,80 |
| ———————— | ——— |
| Total | €167,40 |
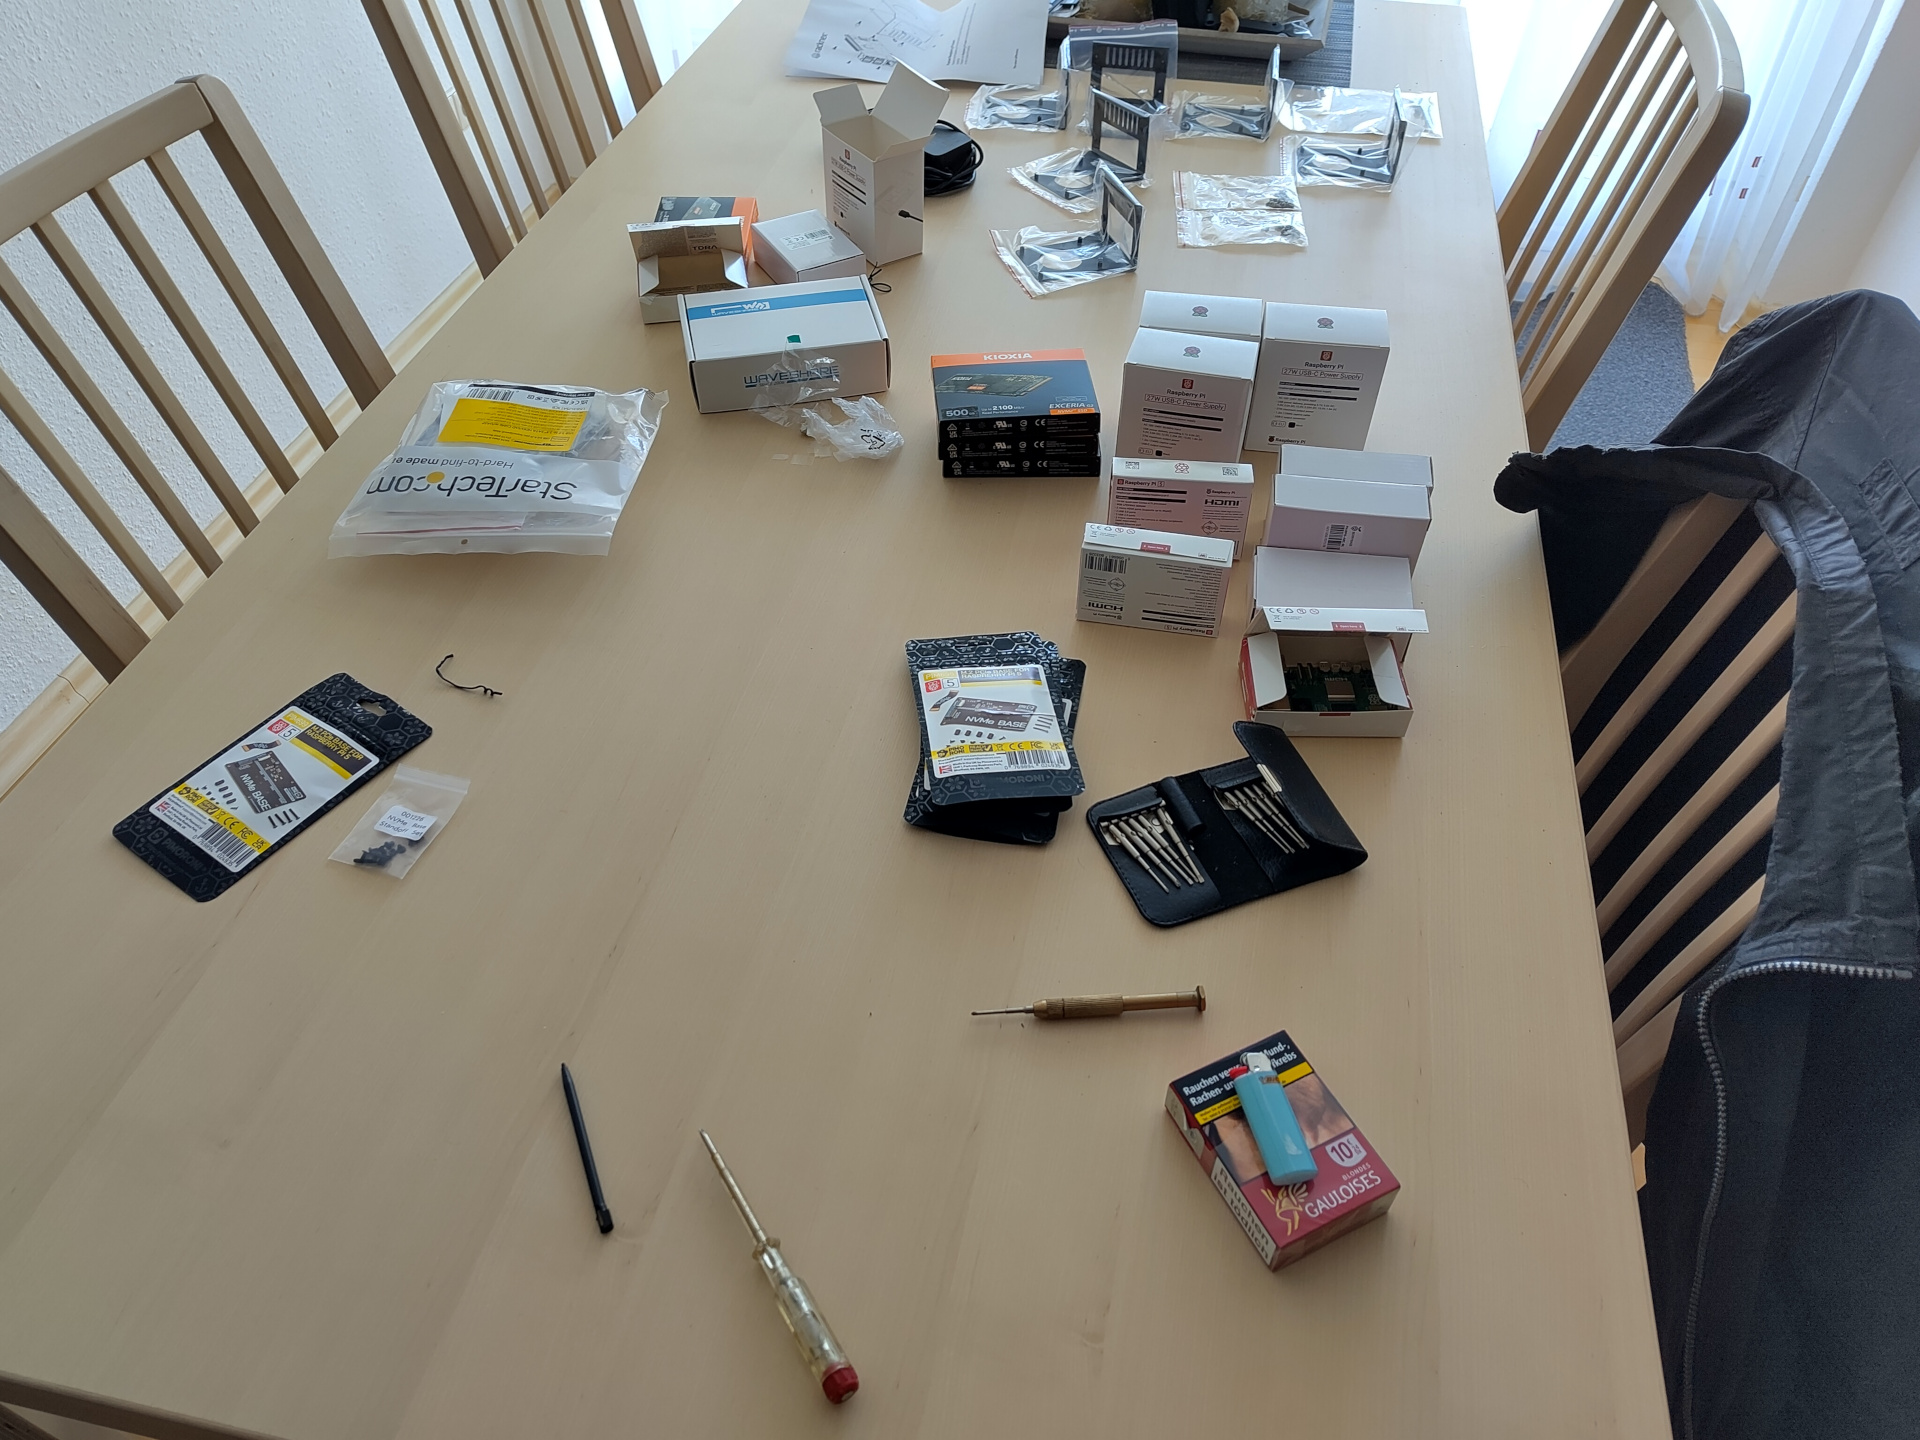
Construction
With all of things arriving, I could get to my least favorite part of Homelabbing: Hardware. That was a bit of a challenge in this project, mostly due to the PCIe flat cable connecting the Pi and the NVMe base. Sadly, I only now realized that I completely forgot to take pictures of the construction process. So this is what one of the Pis looks like fully constructed:

A finished Raspberry Pi with connected NVMe all mounted on a Racknex mounting plate. I will leave the tale of the installation of that very short PCIe cable at the back to your nightmares.
That flat PCIe cable at the back was a bear to install. Getting it fitted to the NVMe base was not a big problem. But then getting it fitted to the Pi, with the PCIe base already connected was a nightmare. It was mostly that the cable is extremely short, and you have to hold up the Pi awkwardly while somehow trying to connect the cable to the NVMe base. Pimoroni’s install instructions were generally okay, but their proposed order was to first connect the cable to the base and then connect the Pi side. I found this entirely impossible. If you look very closely, the heat sink only has a small cutout to put in the PCIe cable. Doing that while the NVMe base is already connected proved impossible, at least at my level of dexterity, so I went the other way around. That was still a pain. If I had bungled the job on one of the Pis and had to reseat the cable, you might now be reading a post about my imminent plan to move my entire Homelab to a few dedicated servers at Hetzner. 😬
One important part to note: The M2.5 screws which come with the Pimoroni NVMe base are long enough to connect the base, the Pi and the heat sink. But they turned out too short to also fit the mounting plate. I had to order an additional set of M2.5 x 20mm screws. Those were long enough to hold it all together.
Once deployed, this is what the three Pis looked like in the rack:

My three Pi 5 mounted in the Racknex mount on the right. The two Pi 4 on the left, connected to their SATA SSDs, are a similar setup as my control plane Pis had previously.
Can we all agree on ignoring the fact that you can see where the SSDs for the Pi 4 control nodes were mounted before? Thank you. 😁
Looking closer at the Pi 5
Now that the hardware is build, let’s take a closer look at the Pi 5. I have a fourth Pi, with 16 GB of RAM and a 1 TB SSD, for some later project, and did some initial testing with it. As with the rest of my Pi fleet, I’m using Ubuntu here, in version 24.04, which is the first one compatible with the Pi 5.
I used the ubuntu-24.04.2-preinstalled-server-arm64+raspi.img.xz image from
the Ubuntu download page.
But before putting it on a USB stick, I wanted to enable the PCIe Gen3 support.
This is not officially supported, but it worked immediately on all three of my
Pi 5 and I haven’t had any issues in the week I’ve now been running them.
I started by mounting the image locally:
losetup -f --show -P ubuntu-24.04.2-preinstalled-server-arm64+raspi.img
mount /dev/loop0p1 /mnt/raspi_boot/
mount /dev/loop0p2 /mnt/raspi_root/
Then I enabled the Gen3 support by adding the following lines to /boot/firmware/config.txt:
[pi5]
dtparam=pciex1
dtparam=pciex1_gen=3
Unmounting it all works like this:
umount /mnt/raspi_boot/ /mnt/raspi_root/
losetup -d /dev/loop0
And then I wrote it onto a USB stick with this command:
dd bs=4M if=ubuntu-24.04.2-preinstalled-server-arm64+raspi.img of=/dev/YOUR_USB_STICK_HERE status=progress oflag=sync
The Pi immediately booted up - I saw it soliciting an IP from my DHCP server. But I wasn’t able to SSH in, because while SSH is enabled in the image, password login is disabled for security reasons.
But I had come prepared. I’ve been wanting to get myself a small screen for
debugging boot issues with my Pis for a long time, because I found connecting one
of my main monitors and switching the source around a bit tedious. I ended up
with this screen.
It’s a bit overkill, because it’s also a touch screen, but eh. That’s how I
could set up the Pi like this: A small 5 inch screen for my Pi experiments was a good idea.
ubuntu.
That finally done came the moment of truth: Would the NVMe SSD be visible? I was feeling quite some dread at this moment. Mostly because the first thing I would have to do for debugging was to try reseating that fiddly PCIe cable. But I got lucky:
root@ubuntu:/tmp/disk-mount# lsblk
NAME    MAJ:MIN RM   SIZE RO TYPE MOUNTPOINTS
loop0     7:0    0  38.7M  1 loop /snap/snapd/23546
loop1     7:1    0  38.7M  1 loop /snap/snapd/23772
sda       8:0    1  57.3G  0 disk
├─sda1    8:1    1   512M  0 part /boot/firmware
└─sda2    8:2    1  56.8G  0 part /
nvme0n1 259:0    0 931.5G  0 disk /tmp/disk-mount
The NVMe SSD was recognized! 🎉
Next question: Was the Gen3 option working? First, I looked at the dmesg output
and found these encouraging lines:
[    2.123345] brcm-pcie 1000110000.pcie: Forcing gen 3
[    2.382834] pci 0000:01:00.0: 7.876 Gb/s available PCIe bandwidth, limited by 8.0 GT/s PCIe x1 link at 0000:00:00.0 (capable of 31.504 Gb/s with 8.0 GT/s PCIe x4 link)
I went one step further and also checked lspci, because that could have also
been some other PCIe Gen 3 link:
lspci -vv
0000:01:00.0 Non-Volatile memory controller: KIOXIA Corporation NVMe SSD (rev 01) (prog-if 02 [NVM Express])
	Subsystem: KIOXIA Corporation NVMe SSD
	Control: I/O- Mem+ BusMaster+ SpecCycle- MemWINV- VGASnoop- ParErr- Stepping- SERR- FastB2B- DisINTx+
	Status: Cap+ 66MHz- UDF- FastB2B- ParErr- DEVSEL=fast >TAbort- <TAbort- <MAbort- >SERR- <PERR- INTx-
	Latency: 0
	Interrupt: pin A routed to IRQ 42
	Region 0: Memory at 1b00000000 (64-bit, non-prefetchable) [size=16K]
	Capabilities: [80] Express (v2) Endpoint, MSI 00
		DevCap:	MaxPayload 256 bytes, PhantFunc 0, Latency L0s unlimited, L1 unlimited
			ExtTag+ AttnBtn- AttnInd- PwrInd- RBE+ FLReset+ SlotPowerLimit 0W
		DevCtl:	CorrErr+ NonFatalErr+ FatalErr+ UnsupReq+
			RlxdOrd+ ExtTag+ PhantFunc- AuxPwr- NoSnoop+ FLReset-
			MaxPayload 256 bytes, MaxReadReq 512 bytes
		DevSta:	CorrErr- NonFatalErr- FatalErr- UnsupReq- AuxPwr- TransPend-
		LnkCap:	Port #0, Speed 8GT/s, Width x4, ASPM L1, Exit Latency L1 <64us
			ClockPM- Surprise- LLActRep- BwNot- ASPMOptComp+
		LnkCtl:	ASPM Disabled; RCB 64 bytes, Disabled- CommClk+
			ExtSynch- ClockPM- AutWidDis- BWInt- AutBWInt-
		LnkSta:	Speed 8GT/s, Width x1 (downgraded)
			TrErr- Train- SlotClk+ DLActive- BWMgmt- ABWMgmt-
		DevCap2: Completion Timeout: Range ABCD, TimeoutDis+ NROPrPrP- LTR+
			 10BitTagComp- 10BitTagReq- OBFF Not Supported, ExtFmt+ EETLPPrefix-
			 EmergencyPowerReduction Not Supported, EmergencyPowerReductionInit-
			 FRS- TPHComp- ExtTPHComp-
			 AtomicOpsCap: 32bit- 64bit- 128bitCAS-
		DevCtl2: Completion Timeout: 50us to 50ms, TimeoutDis- LTR+ 10BitTagReq- OBFF Disabled,
			 AtomicOpsCtl: ReqEn-
		LnkCap2: Supported Link Speeds: 2.5-8GT/s, Crosslink- Retimer- 2Retimers- DRS-
		LnkCtl2: Target Link Speed: 8GT/s, EnterCompliance- SpeedDis-
			 Transmit Margin: Normal Operating Range, EnterModifiedCompliance- ComplianceSOS-
			 Compliance Preset/De-emphasis: -6dB de-emphasis, 0dB preshoot
		LnkSta2: Current De-emphasis Level: -6dB, EqualizationComplete+ EqualizationPhase1+
			 EqualizationPhase2+ EqualizationPhase3+ LinkEqualizationRequest-
			 Retimer- 2Retimers- CrosslinkRes: unsupported
	Capabilities: [d0] MSI-X: Enable+ Count=9 Masked-
		Vector table: BAR=0 offset=00002000
		PBA: BAR=0 offset=00003000
	Capabilities: [e0] MSI: Enable- Count=1/8 Maskable- 64bit+
		Address: 0000000000000000  Data: 0000
	Capabilities: [f8] Power Management version 3
		Flags: PMEClk- DSI- D1- D2- AuxCurrent=0mA PME(D0-,D1-,D2-,D3hot-,D3cold-)
		Status: D0 NoSoftRst+ PME-Enable- DSel=0 DScale=0 PME-
	Capabilities: [100 v1] Latency Tolerance Reporting
		Max snoop latency: 0ns
		Max no snoop latency: 0ns
	Capabilities: [110 v1] L1 PM Substates
		L1SubCap: PCI-PM_L1.2+ PCI-PM_L1.1+ ASPM_L1.2+ ASPM_L1.1+ L1_PM_Substates+
			  PortCommonModeRestoreTime=10us PortTPowerOnTime=60us
		L1SubCtl1: PCI-PM_L1.2- PCI-PM_L1.1- ASPM_L1.2- ASPM_L1.1-
			   T_CommonMode=0us LTR1.2_Threshold=76800ns
		L1SubCtl2: T_PwrOn=60us
	Capabilities: [128 v1] Alternative Routing-ID Interpretation (ARI)
		ARICap:	MFVC- ACS-, Next Function: 0
		ARICtl:	MFVC- ACS-, Function Group: 0
	Capabilities: [200 v2] Advanced Error Reporting
		UESta:	DLP- SDES- TLP- FCP- CmpltTO- CmpltAbrt- UnxCmplt- RxOF- MalfTLP- ECRC- UnsupReq- ACSViol-
		UEMsk:	DLP- SDES- TLP- FCP- CmpltTO- CmpltAbrt- UnxCmplt- RxOF- MalfTLP- ECRC- UnsupReq- ACSViol-
		UESvrt:	DLP+ SDES- TLP- FCP+ CmpltTO- CmpltAbrt- UnxCmplt- RxOF- MalfTLP+ ECRC- UnsupReq- ACSViol-
		CESta:	RxErr- BadTLP- BadDLLP- Rollover- Timeout- AdvNonFatalErr-
		CEMsk:	RxErr- BadTLP- BadDLLP- Rollover- Timeout- AdvNonFatalErr+
		AERCap:	First Error Pointer: 00, ECRCGenCap- ECRCGenEn- ECRCChkCap+ ECRCChkEn-
			MultHdrRecCap- MultHdrRecEn- TLPPfxPres- HdrLogCap-
		HeaderLog: 00000001 0000070f 0000001c 185194a3
	Capabilities: [300 v1] Secondary PCI Express
		LnkCtl3: LnkEquIntrruptEn- PerformEqu-
		LaneErrStat: 0
	Kernel driver in use: nvme
	Kernel modules: nvme
Okay, that’s a lot. But it did show the expected value for the NVMe SSD, in particular this line:
LnkSta: Speed 8GT/s, Width x1 (downgraded)
So yay, PCIe Gen3 was working. And I got that same result on all four Pis. I know I’m repeating myself, but at that point I was so happy that I wouldn’t need to reseat that PCIe cable.
Next step was to have a look at the boot order. I thought I would need to explicitly add the NVMe disk, but it turns out that the factory firmware already had it in the boot order. I still went in and changed it, because by default the NVMe was tried before USB boot. And I like it to be the other way around, so that I could attach a USB stick if I bork the NVMe install in the future and have it boot off of that first.
The bootloader on Pi sits in an EEPROM chip on the board, and it can be changed
with the rpi-eeprom-config --edit command. It looks something like this:
root@ubuntu:~# rpi-eeprom-config --edit
Updating bootloader EEPROM
 image: /lib/firmware/raspberrypi/bootloader-2712/default/pieeprom-2023-12-06.bin
config_src: blconfig device
config: /tmp/tmplbyfxh81/boot.conf
################################################################################
[all]
BOOT_UART=1
POWER_OFF_ON_HALT=0
BOOT_ORDER=0xf641

################################################################################

*** To cancel this update run 'sudo rpi-eeprom-update -r' ***

*** CREATED UPDATE /tmp/tmplbyfxh81/pieeprom.upd  ***

   WARNING: Installing an older bootloader version.
            Update the rpi-eeprom package to fetch the latest bootloader images.

   CURRENT: Mon Sep 23 13:02:56 UTC 2024 (1727096576)
    UPDATE: Wed Dec  6 18:29:25 UTC 2023 (1701887365)
    BOOTFS: /boot/firmware
'/tmp/tmp.joXPbvsUuq' -> '/boot/firmware/pieeprom.upd'
Copying recovery.bin to /boot/firmware for EEPROM update

EEPROM updates pending. Please reboot to apply the update.
To cancel a pending update run "sudo rpi-eeprom-update -r".
The problem I ran into here was this line:
WARNING: Installing an older bootloader version.
         Update the rpi-eeprom package to fetch the latest bootloader images.

CURRENT: Mon Sep 23 13:02:56 UTC 2024 (1727096576)
 UPDATE: Wed Dec  6 18:29:25 UTC 2023 (1701887365)
The EEPROM version in Ubuntu, even the new Ubuntu 24.04 I was running, was too old. And there was nothing newer available for the LTS release either. So I installed this PPA. After that, I got the same version in the EEPROM update as the factory firmware.
Testing the Pi 5
Next up were a couple of performance tests. I was particularly interested in the IOPS of the NVMe Pi 5 versus the Pi 4 with a USB-attached SATA SSD, because I think that the stability issues were mostly due to IO, not CPU performance.
I used fio to test the performance on the Pi 5 and Pi 4. On both, I used the following invocation:
fio --size=20M --rw=randrw --name=IOPS --bs=4k --direct=1 --filename=/tmp/disk/testfile --numjobs=4 --ioengine=libaio --iodepth=32 --refill_buffers --group_reporting --runtime=60 --time_based
So I did random read/write, with a block size of 4k, using direct IO, meaning ignoring all FS caches, running for 60 second using the libaio engine. I also ran four processes in parallel, as I figure that there would be more than one writer with the machines serving as control plane nodes.
The full results for the Pi 5 look like this:
IOPS: (groupid=0, jobs=4): err= 0: pid=5241: Mon Apr 21 14:24:29 2025
  read: IOPS=151k, BW=589MiB/s (618MB/s)(34.5GiB/60001msec)
    slat (usec): min=2, max=3070, avg= 5.50, stdev= 6.14
    clat (usec): min=53, max=5266, avg=503.04, stdev=121.10
     lat (usec): min=58, max=5269, avg=508.54, stdev=121.22
    clat percentiles (usec):
     |  1.00th=[  302],  5.00th=[  347], 10.00th=[  371], 20.00th=[  408],
     | 30.00th=[  433], 40.00th=[  461], 50.00th=[  490], 60.00th=[  519],
     | 70.00th=[  553], 80.00th=[  594], 90.00th=[  652], 95.00th=[  701],
     | 99.00th=[  816], 99.50th=[  881], 99.90th=[ 1139], 99.95th=[ 1582],
     | 99.99th=[ 2999]
   bw (  KiB/s): min=582384, max=624383, per=100.00%, avg=604312.95, stdev=1736.39, samples=476
   iops        : min=145596, max=156095, avg=151077.84, stdev=434.11, samples=476
  write: IOPS=151k, BW=589MiB/s (618MB/s)(34.5GiB/60001msec); 0 zone resets
    slat (usec): min=3, max=3058, avg= 6.69, stdev= 7.72
    clat (usec): min=21, max=5212, avg=330.48, stdev=86.79
     lat (usec): min=28, max=5216, avg=337.17, stdev=87.20
    clat percentiles (usec):
     |  1.00th=[  208],  5.00th=[  245], 10.00th=[  262], 20.00th=[  281],
     | 30.00th=[  293], 40.00th=[  306], 50.00th=[  318], 60.00th=[  330],
     | 70.00th=[  343], 80.00th=[  367], 90.00th=[  420], 95.00th=[  474],
     | 99.00th=[  594], 99.50th=[  660], 99.90th=[  906], 99.95th=[ 1156],
     | 99.99th=[ 2933]
   bw (  KiB/s): min=584860, max=622736, per=100.00%, avg=603963.50, stdev=1777.65, samples=476
   iops        : min=146215, max=155684, avg=150990.54, stdev=444.42, samples=476
  lat (usec)   : 50=0.01%, 100=0.02%, 250=3.28%, 500=71.81%, 750=23.57%
  lat (usec)   : 1000=1.19%
  lat (msec)   : 2=0.10%, 4=0.03%, 10=0.01%
  cpu          : usr=17.90%, sys=49.51%, ctx=9396343, majf=0, minf=62
  IO depths    : 1=0.1%, 2=0.1%, 4=0.1%, 8=0.1%, 16=0.1%, 32=100.0%, >=64=0.0%
     submit    : 0=0.0%, 4=100.0%, 8=0.0%, 16=0.0%, 32=0.0%, 64=0.0%, >=64=0.0%
     complete  : 0=0.0%, 4=100.0%, 8=0.0%, 16=0.0%, 32=0.1%, 64=0.0%, >=64=0.0%
     issued rwts: total=9052812,9047408,0,0 short=0,0,0,0 dropped=0,0,0,0
     latency   : target=0, window=0, percentile=100.00%, depth=32

Run status group 0 (all jobs):
   READ: bw=589MiB/s (618MB/s), 589MiB/s-589MiB/s (618MB/s-618MB/s), io=34.5GiB (37.1GB), run=60001-60001msec
  WRITE: bw=589MiB/s (618MB/s), 589MiB/s-589MiB/s (618MB/s-618MB/s), io=34.5GiB (37.1GB), run=60001-60001msec

Disk stats (read/write):
  nvme0n1: ios=9025140/9020061, sectors=72201120/72160584, merge=0/12, ticks=4333666/2703156, in_queue=7036831, util=100.00%
The bandwidth was 618 MB/s read and write:
 READ: bw=589MiB/s (618MB/s), 589MiB/s-589MiB/s (618MB/s-618MB/s), io=34.5GiB (37.1GB), run=60001-60001msec
WRITE: bw=589MiB/s (618MB/s), 589MiB/s-589MiB/s (618MB/s-618MB/s), io=34.5GiB (37.1GB), run=60001-60001msec
This is a respectable result, considering that the max for PCIe Gen3 x1 is around 1 GB/s. But more important for me are the IOPS. While the kube control plane is writing at about 5-6 MB/s, even the USB-attached SATA SSDs shouldn’t have had a problem with that. And the IOPS were looking quite good:
read: IOPS=151k, BW=589MiB/s (618MB/s)(34.5GiB/60001msec)
 iops        : min=145596, max=156095, avg=151077.84, stdev=434.11, samples=476
write: IOPS=151k, BW=589MiB/s (618MB/s)(34.5GiB/60001msec); 0 zone resets
 iops        : min=146215, max=155684, avg=150990.54, stdev=444.42, samples=476
Both read and write reach over 145k IOPS. So let’s look at the Pi 4 and its USB-attached SATA SSD next:
IOPS: (groupid=0, jobs=4): err= 0: pid=27703: Mon Apr 21 16:33:26 2025
  read: IOPS=9989, BW=39.0MiB/s (40.9MB/s)(2341MiB/60002msec)
    slat (usec): min=14, max=63796, avg=182.32, stdev=1012.51
    clat (usec): min=229, max=160456, avg=5308.50, stdev=8919.53
     lat (usec): min=278, max=160518, avg=5490.82, stdev=9174.55
    clat percentiles (usec):
     |  1.00th=[  1123],  5.00th=[  1598], 10.00th=[  1958], 20.00th=[  2409],
     | 30.00th=[  2704], 40.00th=[  3032], 50.00th=[  3425], 60.00th=[  3884],
     | 70.00th=[  4490], 80.00th=[  5342], 90.00th=[  6915], 95.00th=[  9110],
     | 99.00th=[ 55837], 99.50th=[ 66323], 99.90th=[ 88605], 99.95th=[ 99091],
     | 99.99th=[116917]
   bw (  KiB/s): min= 3542, max=63975, per=99.82%, avg=39884.73, stdev=5709.77, samples=476
   iops        : min=  885, max=15993, avg=9970.55, stdev=1427.44, samples=476
  write: IOPS=10.0k, BW=39.1MiB/s (41.0MB/s)(2346MiB/60002msec); 0 zone resets
    slat (usec): min=15, max=53787, avg=187.38, stdev=1055.71
    clat (usec): min=703, max=184799, avg=7109.60, stdev=10493.22
     lat (usec): min=929, max=184878, avg=7296.98, stdev=10765.19
    clat percentiles (msec):
     |  1.00th=[    3],  5.00th=[    3], 10.00th=[    3], 20.00th=[    4],
     | 30.00th=[    5], 40.00th=[    5], 50.00th=[    5], 60.00th=[    6],
     | 70.00th=[    7], 80.00th=[    8], 90.00th=[    9], 95.00th=[   12],
     | 99.00th=[   65], 99.50th=[   81], 99.90th=[  108], 99.95th=[  117],
     | 99.99th=[  146]
   bw (  KiB/s): min= 3728, max=64184, per=99.79%, avg=39957.87, stdev=5722.84, samples=476
   iops        : min=  932, max=16046, avg=9988.86, stdev=1430.70, samples=476
  lat (usec)   : 250=0.01%, 500=0.01%, 750=0.03%, 1000=0.22%
  lat (msec)   : 2=5.41%, 4=40.14%, 10=48.37%, 20=2.36%, 50=1.65%
  lat (msec)   : 100=1.72%, 250=0.10%
  cpu          : usr=4.22%, sys=39.42%, ctx=342409, majf=0, minf=108
  IO depths    : 1=0.1%, 2=0.1%, 4=0.1%, 8=0.1%, 16=0.1%, 32=100.0%, >=64=0.0%
     submit    : 0=0.0%, 4=100.0%, 8=0.0%, 16=0.0%, 32=0.0%, 64=0.0%, >=64=0.0%
     complete  : 0=0.0%, 4=100.0%, 8=0.0%, 16=0.0%, 32=0.1%, 64=0.0%, >=64=0.0%
     issued rwts: total=599380,600626,0,0 short=0,0,0,0 dropped=0,0,0,0
     latency   : target=0, window=0, percentile=100.00%, depth=32

Run status group 0 (all jobs):
   READ: bw=39.0MiB/s (40.9MB/s), 39.0MiB/s-39.0MiB/s (40.9MB/s-40.9MB/s), io=2341MiB (2455MB), run=60002-60002msec
  WRITE: bw=39.1MiB/s (41.0MB/s), 39.1MiB/s-39.1MiB/s (41.0MB/s-41.0MB/s), io=2346MiB (2460MB), run=60002-60002msec

Disk stats (read/write):
  sda: ios=592523/587906, sectors=4786048/4795680, merge=5733/11554, ticks=1431760/1951190, in_queue=3383201, util=70.66%
Well, yeah. The bandwidth doesn’t get beyond 41 MB/s in read or write:
 READ: bw=39.0MiB/s (40.9MB/s), 39.0MiB/s-39.0MiB/s (40.9MB/s-40.9MB/s), io=2341MiB (2455MB), run=60002-60002msec
WRITE: bw=39.1MiB/s (41.0MB/s), 39.1MiB/s-39.1MiB/s (41.0MB/s-41.0MB/s), io=2346MiB (2460MB), run=60002-60002msec
And the IOPS aren’t looking any better:
  read: IOPS=9989, BW=39.0MiB/s (40.9MB/s)(2341MiB/60002msec)
   iops        : min=  885, max=15993, avg=9970.55, stdev=1427.44, samples=476
  write: IOPS=10.0k, BW=39.1MiB/s (41.0MB/s)(2346MiB/60002msec); 0 zone resets
   iops        : min=  932, max=16046, avg=9988.86, stdev=1430.70, samples=476
Again, yeah. Especially the min values are looking really bad - not even 1k IOPS?
And the averages just below 10k aren’t exactly awe-inspiring. So the Pi 5 with
NVMe disks gave me an entire order of magnitude more IO - both for bandwidth and
for IOPS.
Next up, some temperature testing. I was worried in this area, because most Pi 5
cases seem to have an active cooler. But I really wanted the passive heat sink
to work. First, I observed that at idle, the Pi 5 already reached about 50 C.
Not a great sign. To put a bit of load on the machine, I started running
stress -c4 -t 600 and watched the temps with watch -n 5 cat /sys/class/thermal/thermal_zone0/temp.
I also kept an eye on the CPU frequency to make sure the PI didn’t downclock
with watch -n 5 cat /sys/devices/system/cpu/cpu*/cpufreq/scaling_cur_freq.
The good news is that no downclocking happened. But also, at the end of those
10 minutes, the temps were at a toasty 78 C. And it didn’t look like the temps
were stable there, and if I had left it running for a bit longer it might have
gone higher.
Looking at the temps on my deployed Pis, I didn’t need to worry: The temps of all three, running the k8s control plane, are around 52 - 55 C. One more piece to note is the NVMe temp. There’s zero airflow over it. I don’t gather the NVMe temps in my metrics, but I did a couple of spot checks, and the temps were around 65 C. Well within the SSD’s spec, but also something I need to keep a closer eye on in the future. If push comes to shove, I can mount a couple of large Noctua fans behind the Pis, and that should be enough, even at low RPMs.
This concluded the testing, and the last thing remaining was to verify that my Ansible playbooks worked against a Pi 5 without changes. And they did. Both my image creation with HashiCorp’s Packer and my main deployment playbook worked without any change, and booting the test Pi off of the NVMe worked out of the box. The only change I had to make was to add the PCIe Gen3 config to the Raspberry Pi play. It’s very nice to see how little changes I needed.
Deploying the Pis
For the deployment of the Pis, I’d set myself a somewhat complicated goal: I wanted to keep using the host names of my current control plane hosts. Which made the initial install more bothersome. But I decided against taking down the original nodes first, because I didn’t want to leave the cluster with only two CP nodes during the new host’s install, especially considering the instability that already existed.
So I had roughly the following steps:
- Boot new Pi from USB
- Adapt boot order to put NVMe behind USB
- Add a temporary entry with a temporary name in static DHCP
- Generate image, but again with temporary hostname
- Install image onto the NVMe SSD and reboot
- Run full Ubuntu update, set root PW
- Run full deployment Ansible playbook
- Drain the old control plane node
- Remove the old CP node from the Kubernetes cluster with
kubeadm resetandkubectl delete node foo - Shutdown both nodes
- Deploy new HW and remove old Pi 4
- Update DHCP entry of old CP node with new Pi 5 MAC and remove temporary entry
- Boot new node
- Go into Ansible, set node name for new node and re-run deployment playbook, which also sets the hostname
- Reboot new node
- Add new node to k8s cluster as control plane
In contrast to previous attempts of mine to switch control plane hosts, this one went off without a hitch.
And since that moment, I did not have any spurious restarts of any control plane Pods anymore. Not a single one. So problem solved. By throwing better hardware at it. 😁
But before I end this post, here’s two more plots. This one shows the CPU utilization
of one of the Pi 4 control plane nodes during a random day: CPU utilization of a Pi 4 control plane node. CPU utilization of a Pi 5 control plane node.

These plots show the more powerful Pi 5 CPU. They also indicate that the IOPS issue is gone, as the Pi 5 plot doesn’t have any IOWAIT spikes anymore.
I would have also loved to show a power consumption plot, but honestly, I don’t see any changes after switching to the Pi 5.
Conclusion
This was a pretty nice project. It accomplished exactly what I had hoped, and I didn’t have any issues at all. Besides those PCIe cables. They almost drove my entire Homelab into the arms of Hetzner.
Next up will be a post about migrating my Prometheus metrics storage to Thanos.
Re-reading the post and editing a bit, I should perhaps make the next project a switch of my blog’s theme. Those Grafana screenshots really are not very readable. I need a theme which allows clicking on a figure and enlarging it.