Wherein I set up some Prometheus metrics gathering from Ceph’s S3 RGW and build a dashboard to show the data.
I like metrics. And dashboards. And plots. And one of the things I’ve been missing up to now was data from Ceph’s RadosGateway. That’s the Ceph daemon which provides an S3 (and Swift) compatible API for Ceph clusters.
While Rook, the tool I’m using to deploy Ceph in my k8s cluster, already wires up Ceph’s own exporters to be scraped by a Prometheus Operator, that does not include S3 data. My main interest here is the development of bucket sizes over time, so I can see early when something is misconfigured. Up to now, the only indicator I had was the size of the pool backing the RadosGW, which currently stands at 1.42 TB, which makes it the second-largest pool in my cluster.
For providing the data in Prometheus format, I’m using this exporter.
It uses the RadosGW’s Usage API
to get the data and converts it into Prometheus format.
This data can also requested with radosgw-admin:
radosgw-admin usage show
This shows data for all users and buckets. An example output just for my blog bucket/user looks like this:
{
    "entries": [
        {
            "user": "blog",
            "buckets": [
                {
                    "bucket": "blog",
                    "time": "2024-01-21T00:00:00.000000Z",
                    "epoch": 1705795200,
                    "owner": "blog",
                    "categories": [
                        [...]
                        {
                            "category": "get_obj",
                            "bytes_sent": 2995740956,
                            "bytes_received": 0,
                            "ops": 79510,
                            "successful_ops": 79496
                        },
                        {
                            "category": "put_obj",
                            "bytes_sent": 0,
                            "bytes_received": 61606006,
                            "ops": 869,
                            "successful_ops": 869
                        },
                        [...]
                    ],
                },
                [...]
                {
                    "bucket": "blog",
                    "time": "2025-09-13T21:00:00.000000Z",
                    "epoch": 1757797200,
                    "owner": "blog",
                    "categories": [
                        [...]
                        {
                            "category": "get_obj",
                            "bytes_sent": 4085435893,
                            "bytes_received": 0,
                            "ops": 81549,
                            "successful_ops": 81516
                        },
                        {
                            "category": "put_obj",
                            "bytes_sent": 0,
                            "bytes_received": 10946996,
                            "ops": 315,
                            "successful_ops": 315
                        }
                        [...]
                    ],
                }
            ]
        }
    ],
    "summary": [
        {
            "user": "blog",
            "categories": [
                [...]
                {
                    "category": "get_obj",
                    "bytes_sent": 77373327028,
                    "bytes_received": 0,
                    "ops": 1832858,
                    "successful_ops": 1779988
                },
                {
                    "category": "put_obj",
                    "bytes_sent": 0,
                    "bytes_received": 293350218,
                    "ops": 7572,
                    "successful_ops": 7572
                },
                [...]
            ],
            "total": {
                "bytes_sent": 77408103266,
                "bytes_received": 293350218,
                "ops": 1840790,
                "successful_ops": 1787784,
                "bytes_processed": 0,
                "bytes_returned": 0
            }
        }
    ]
}
For this data to be gathered and made available, the option rgw_enable_usage_log = true
needs to be configured in the MON config database or directly in the RGW ceph.conf
file. In my case at least, the option seemed to be enabled by default, but I’m
not sure whether I enabled it at some point, or whether it was enabled by Rook.
Next step was building the container image for the exporter, using the Dockerfile already available in the repository.
Then came the deployment into my k8s cluster. I based my deployment on the example files for a Rook Ceph deployment also provided in the repository.
First, the Ceph RGW user, so the exporter can access the Usage API:
apiVersion: ceph.rook.io/v1
kind: CephObjectStoreUser
metadata:
  name: buckets-usage-exporter
spec:
  store: rgw-bulk
  clusterNamespace: rook-cluster
  displayName: buckets-usage-exporter
  capabilities:
    bucket: read
    metadata: read
    usage: read
    user: read
Then the Deployment:
apiVersion: apps/v1
kind: Deployment
metadata:
  name: rgw-exporter
  labels:
    app.kubernetes.io/name: rgw-exporter
spec:
  selector:
    matchLabels:
      app.kubernetes.io/name: rgw-exporter
  template:
    metadata:
      labels:
        app.kubernetes.io/name: rgw-exporter
    spec:
      containers:
      - image: images.example.com/homelab/rgw-exporter:0.1
        env:
        - name: ACCESS_KEY
          valueFrom:
            secretKeyRef:
              key: AccessKey
              name: rook-ceph-object-user-rgw-bulk-buckets-usage-exporter
        - name: SECRET_KEY
          valueFrom:
            secretKeyRef:
              key: SecretKey
              name: rook-ceph-object-user-rgw-bulk-buckets-usage-exporter
        - name: RADOSGW_SERVER
          valueFrom:
            secretKeyRef:
              key: Endpoint
              name: rook-ceph-object-user-rgw-bulk-buckets-usage-exporter
        - name: VIRTUAL_PORT
          value: "9242"
        - name: STORE
          value: rgw-bulk
        - name: LOG_LEVEL
          value: INFO
        - name: TIMEOUT
          value: "60"
        args:
        - --insecure
        name: exporter
        ports:
        - containerPort: 9242
          name: http
          protocol: TCP
        resources:
          limits:
            memory: 40Mi
          requests:
            cpu: 10m
            memory: 40Mi
        livenessProbe:
          tcpSocket:
            port: http
        readinessProbe:
          tcpSocket:
            port: http
        securityContext:
          allowPrivilegeEscalation: false
          capabilities:
            drop:
            - ALL
          readOnlyRootFilesystem: true
      securityContext:
        runAsNonRoot: true
        runAsUser: 1000
Next, the Service for the exporter:
apiVersion: v1
kind: Service
metadata:
  name: rgw-exporter
  labels:
    app.kubernetes.io/name: rgw-exporter
spec:
  selector:
    app.kubernetes.io/name: rgw-exporter
  ports:
  - name: http
    port: 9242
    protocol: TCP
    targetPort: 9242
And last but certainly not least, the ServiceMonitor, which tells the Prometheus Operator to scrape the exporter:
apiVersion: monitoring.coreos.com/v1
kind: ServiceMonitor
metadata:
  name: rgw-exporter
  labels:
    app.kubernetes.io/name: rgw-exporter
spec:
  selector:
    matchLabels:
      app.kubernetes.io/name: rgw-exporter
  endpoints:
  - honorLabels: true
    interval: 90s
    path: /metrics
    port: http
    scheme: http
    scrapeTimeout: 60s
    metricRelabelings:
      - action: drop
        regex: 'python_gc_.*'
        sourceLabels: [__name__]
      - action: drop
        regex: 'process_.*'
        sourceLabels: [__name__]
      - action: drop
        regex: 'radosgw_usage_bucket_quota_.*'
        sourceLabels: [__name__]
      - action: drop
        regex: 'radosgw_usage_user_quota_.*'
        sourceLabels: [__name__]
      - action: drop
        regex: 'radosgw_usage_user_bucket_quota_.*'
        sourceLabels: [__name__]
      - action: drop
        regex: '(get_bucket_encryption|get_bucket_object_lock|get_bucket_policy|get_bucket_tags|get_cors|get_lifecycle|get_acls|get_bucket_location|get_bucket_policy|get_bucket_public_access_block|get_bucket_versioning|get_request_payment|put_acls|put_bucket_policy|stat_bucket|delete_bucket_policy|get_bucket_replication)'
        sourceLabels: [category]
  jobLabel: rgw-exporter
This is the only part of the example where I made major changes. First, there are
as always a few metrics from the exporter itself, which I’m never interested in.
Then, I’m also dropping some quota-related data, because I don’t use quotas at
all. And finally, the exporter provides data on many types of S3 operations per
user/bucket, which leads to quite a lot of data. But I’m not interested in the
data for low-frequency operations like put_acls for example. So I drop
those as well.
I deployed all of this into my Rook cluster namespace (not the Rook operator namespace!).
Before going to the dashboards, here’s a small overview of the data provided by the exporter:
# HELP radosgw_usage_ops_total Number of operations
# TYPE radosgw_usage_ops_total counter
radosgw_usage_ops_total{bucket="-",category="get_bucket_encryption",owner="blog",store="rgw-bulk"} 2.0
radosgw_usage_ops_total{bucket="-",category="get_bucket_object_lock",owner="blog",store="rgw-bulk"} 2.0
radosgw_usage_ops_total{bucket="-",category="get_bucket_policy",owner="blog",store="rgw-bulk"} 1.0
radosgw_usage_ops_total{bucket="-",category="get_bucket_tags",owner="blog",store="rgw-bulk"} 2.0
radosgw_usage_ops_total{bucket="-",category="get_obj",owner="blog",store="rgw-bulk"} 52742.0
radosgw_usage_ops_total{bucket="blog",category="create_bucket",owner="blog",store="rgw-bulk"} 1.0
radosgw_usage_ops_total{bucket="blog",category="get_bucket_policy",owner="blog",store="rgw-bulk"} 3.0
radosgw_usage_ops_total{bucket="blog",category="get_bucket_public_access_block",owner="blog",store="rgw-bulk"} 2.0
radosgw_usage_ops_total{bucket="blog",category="get_bucket_versioning",owner="blog",store="rgw-bulk"} 2.0
radosgw_usage_ops_total{bucket="blog",category="get_obj",owner="blog",store="rgw-bulk"} 1.78032e+06
radosgw_usage_ops_total{bucket="blog",category="get_request_payment",owner="blog",store="rgw-bulk"} 2.0
radosgw_usage_ops_total{bucket="blog",category="list_bucket",owner="blog",store="rgw-bulk"} 164.0
radosgw_usage_ops_total{bucket="blog",category="post_obj",owner="blog",store="rgw-bulk"} 123.0
radosgw_usage_ops_total{bucket="blog",category="put_bucket_policy",owner="blog",store="rgw-bulk"} 2.0
radosgw_usage_ops_total{bucket="blog",category="put_obj",owner="blog",store="rgw-bulk"} 7572.0
radosgw_usage_ops_total{bucket="blog",category="stat_bucket",owner="blog",store="rgw-bulk"} 2.0
radosgw_usage_ops_total{bucket="blog",category="multi_object_delete",owner="blog",store="rgw-bulk"} 4.0
radosgw_usage_ops_total{bucket="blog",category="copy_obj",owner="blog",store="rgw-bulk"} 14.0
radosgw_usage_ops_total{bucket="blog",category="get_acls",owner="blog",store="rgw-bulk"} 14.0
radosgw_usage_ops_total{bucket="blog",category="put_acls",owner="blog",store="rgw-bulk"} 14.0
radosgw_usage_ops_total{bucket="blog",category="get_obj_layout",owner="blog",store="rgw-bulk"} 2.0
radosgw_usage_ops_total{bucket="blog",category="options_cors",owner="blog",store="rgw-bulk"} 4.0
# HELP radosgw_usage_successful_ops_total Number of successful operations
# TYPE radosgw_usage_successful_ops_total counter
radosgw_usage_successful_ops_total{bucket="blog",category="get_obj",owner="blog",store="rgw-bulk"} 1.780191e+06
# HELP radosgw_usage_sent_bytes_total Bytes sent by the RADOSGW
# TYPE radosgw_usage_sent_bytes_total counter
radosgw_usage_sent_bytes_total{bucket="blog",category="get_obj",owner="blog",store="rgw-bulk"} 7.7364643823e+010
# HELP radosgw_usage_received_bytes_total Bytes received by the RADOSGW
# TYPE radosgw_usage_received_bytes_total counter
radosgw_usage_received_bytes_total{bucket="blog",category="get_obj",owner="blog",store="rgw-bulk"} 0.0
# HELP radosgw_usage_bucket_utilized_bytes Bucket utilized bytes
# TYPE radosgw_usage_bucket_utilized_bytes gauge
radosgw_usage_bucket_utilized_bytes{bucket="blog",category="a2367ad5-81df-4ab3-8b6b-cae4bd659f64",owner="blog",store="rgw-bulk"} 1.03238176e+08
# HELP radosgw_usage_bucket_objects Number of objects in bucket
# TYPE radosgw_usage_bucket_objects gauge
radosgw_usage_bucket_objects{bucket="blog",category="a2367ad5-81df-4ab3-8b6b-cae4bd659f64",owner="blog",store="rgw-bulk"} 934.0
# HELP radosgw_usage_bucket_quota_enabled Quota enabled for bucket
# TYPE radosgw_usage_bucket_quota_enabled gauge
radosgw_usage_bucket_quota_enabled{bucket="blog",category="a2367ad5-81df-4ab3-8b6b-cae4bd659f64",owner="blog",store="rgw-bulk"} 0.0
# HELP radosgw_usage_bucket_quota_size Maximum allowed bucket size
# TYPE radosgw_usage_bucket_quota_size gauge
radosgw_usage_bucket_quota_size{bucket="blog",category="a2367ad5-81df-4ab3-8b6b-cae4bd659f64",owner="blog",store="rgw-bulk"} -1.0
# HELP radosgw_usage_bucket_quota_size_bytes Maximum allowed bucket size in bytes
# TYPE radosgw_usage_bucket_quota_size_bytes gauge
radosgw_usage_bucket_quota_size_bytes{bucket="blog",category="a2367ad5-81df-4ab3-8b6b-cae4bd659f64",owner="blog",store="rgw-bulk"} 0.0
# HELP radosgw_usage_bucket_quota_size_objects Maximum allowed bucket size in number of objects
# TYPE radosgw_usage_bucket_quota_size_objects gauge
radosgw_usage_bucket_quota_size_objects{bucket="blog",category="a2367ad5-81df-4ab3-8b6b-cae4bd659f64",owner="blog",store="rgw-bulk"} -1.0
# HELP radosgw_usage_bucket_shards Number ob shards in bucket
# TYPE radosgw_usage_bucket_shards gauge
radosgw_usage_bucket_shards{bucket="blog",category="a2367ad5-81df-4ab3-8b6b-cae4bd659f64",owner="blog",store="rgw-bulk"} 11.0
# HELP radosgw_user_metadata User metadata
# TYPE radosgw_user_metadata gauge
radosgw_user_metadata{display_name="User for the blog",email="",storage_class="",store="rgw-bulk",user="blog"} 1.0
# HELP radosgw_usage_user_quota_enabled User quota enabled
# TYPE radosgw_usage_user_quota_enabled gauge
radosgw_usage_user_quota_enabled{store="rgw-bulk",user="blog"} 0.0
# HELP radosgw_usage_user_quota_size Maximum allowed size for user
# TYPE radosgw_usage_user_quota_size gauge
radosgw_usage_user_quota_size{store="rgw-bulk",user="blog"} -1.0
# HELP radosgw_usage_user_quota_size_bytes Maximum allowed size in bytes for user
# TYPE radosgw_usage_user_quota_size_bytes gauge
radosgw_usage_user_quota_size_bytes{store="rgw-bulk",user="blog"} 0.0
# HELP radosgw_usage_user_quota_size_objects Maximum allowed number of objects across all user buckets
# TYPE radosgw_usage_user_quota_size_objects gauge
radosgw_usage_user_quota_size_objects{store="rgw-bulk",user="blog"} -1.0
# HELP radosgw_usage_user_bucket_quota_enabled User per-bucket-quota enabled
# TYPE radosgw_usage_user_bucket_quota_enabled gauge
radosgw_usage_user_bucket_quota_enabled{store="rgw-bulk",user="blog"} 0.0
# HELP radosgw_usage_user_bucket_quota_size Maximum allowed size for each bucket of user
# TYPE radosgw_usage_user_bucket_quota_size gauge
radosgw_usage_user_bucket_quota_size{store="rgw-bulk",user="blog"} -1.0
# HELP radosgw_usage_user_bucket_quota_size_bytes Maximum allowed size bytes size for each bucket of user
# TYPE radosgw_usage_user_bucket_quota_size_bytes gauge
radosgw_usage_user_bucket_quota_size_bytes{store="rgw-bulk",user="blog"} 0.0
# HELP radosgw_usage_user_bucket_quota_size_objects Maximum allowed number of objects in each user bucket
# TYPE radosgw_usage_user_bucket_quota_size_objects gauge
radosgw_usage_user_bucket_quota_size_objects{store="rgw-bulk",user="blog"} -1.0
# HELP radosgw_usage_user_total_objects Usage of objects by user
# TYPE radosgw_usage_user_total_objects gauge
radosgw_usage_user_total_objects{store="rgw-bulk",user="blog"} 934.0
# HELP radosgw_usage_user_total_bytes Usage of bytes by user
# TYPE radosgw_usage_user_total_bytes gauge
radosgw_usage_user_total_bytes{store="rgw-bulk",user="blog"} 1.0549248e+08
# HELP radosgw_usage_scrape_duration_seconds Ammount of time each scrape takes
# TYPE radosgw_usage_scrape_duration_seconds gauge
radosgw_usage_scrape_duration_seconds 2.390573501586914
I’ve left only the data for my blog bucket in the scrape result. I do not know
what the - bucket in the ops related data represents, I’m afraid.
The dashboard
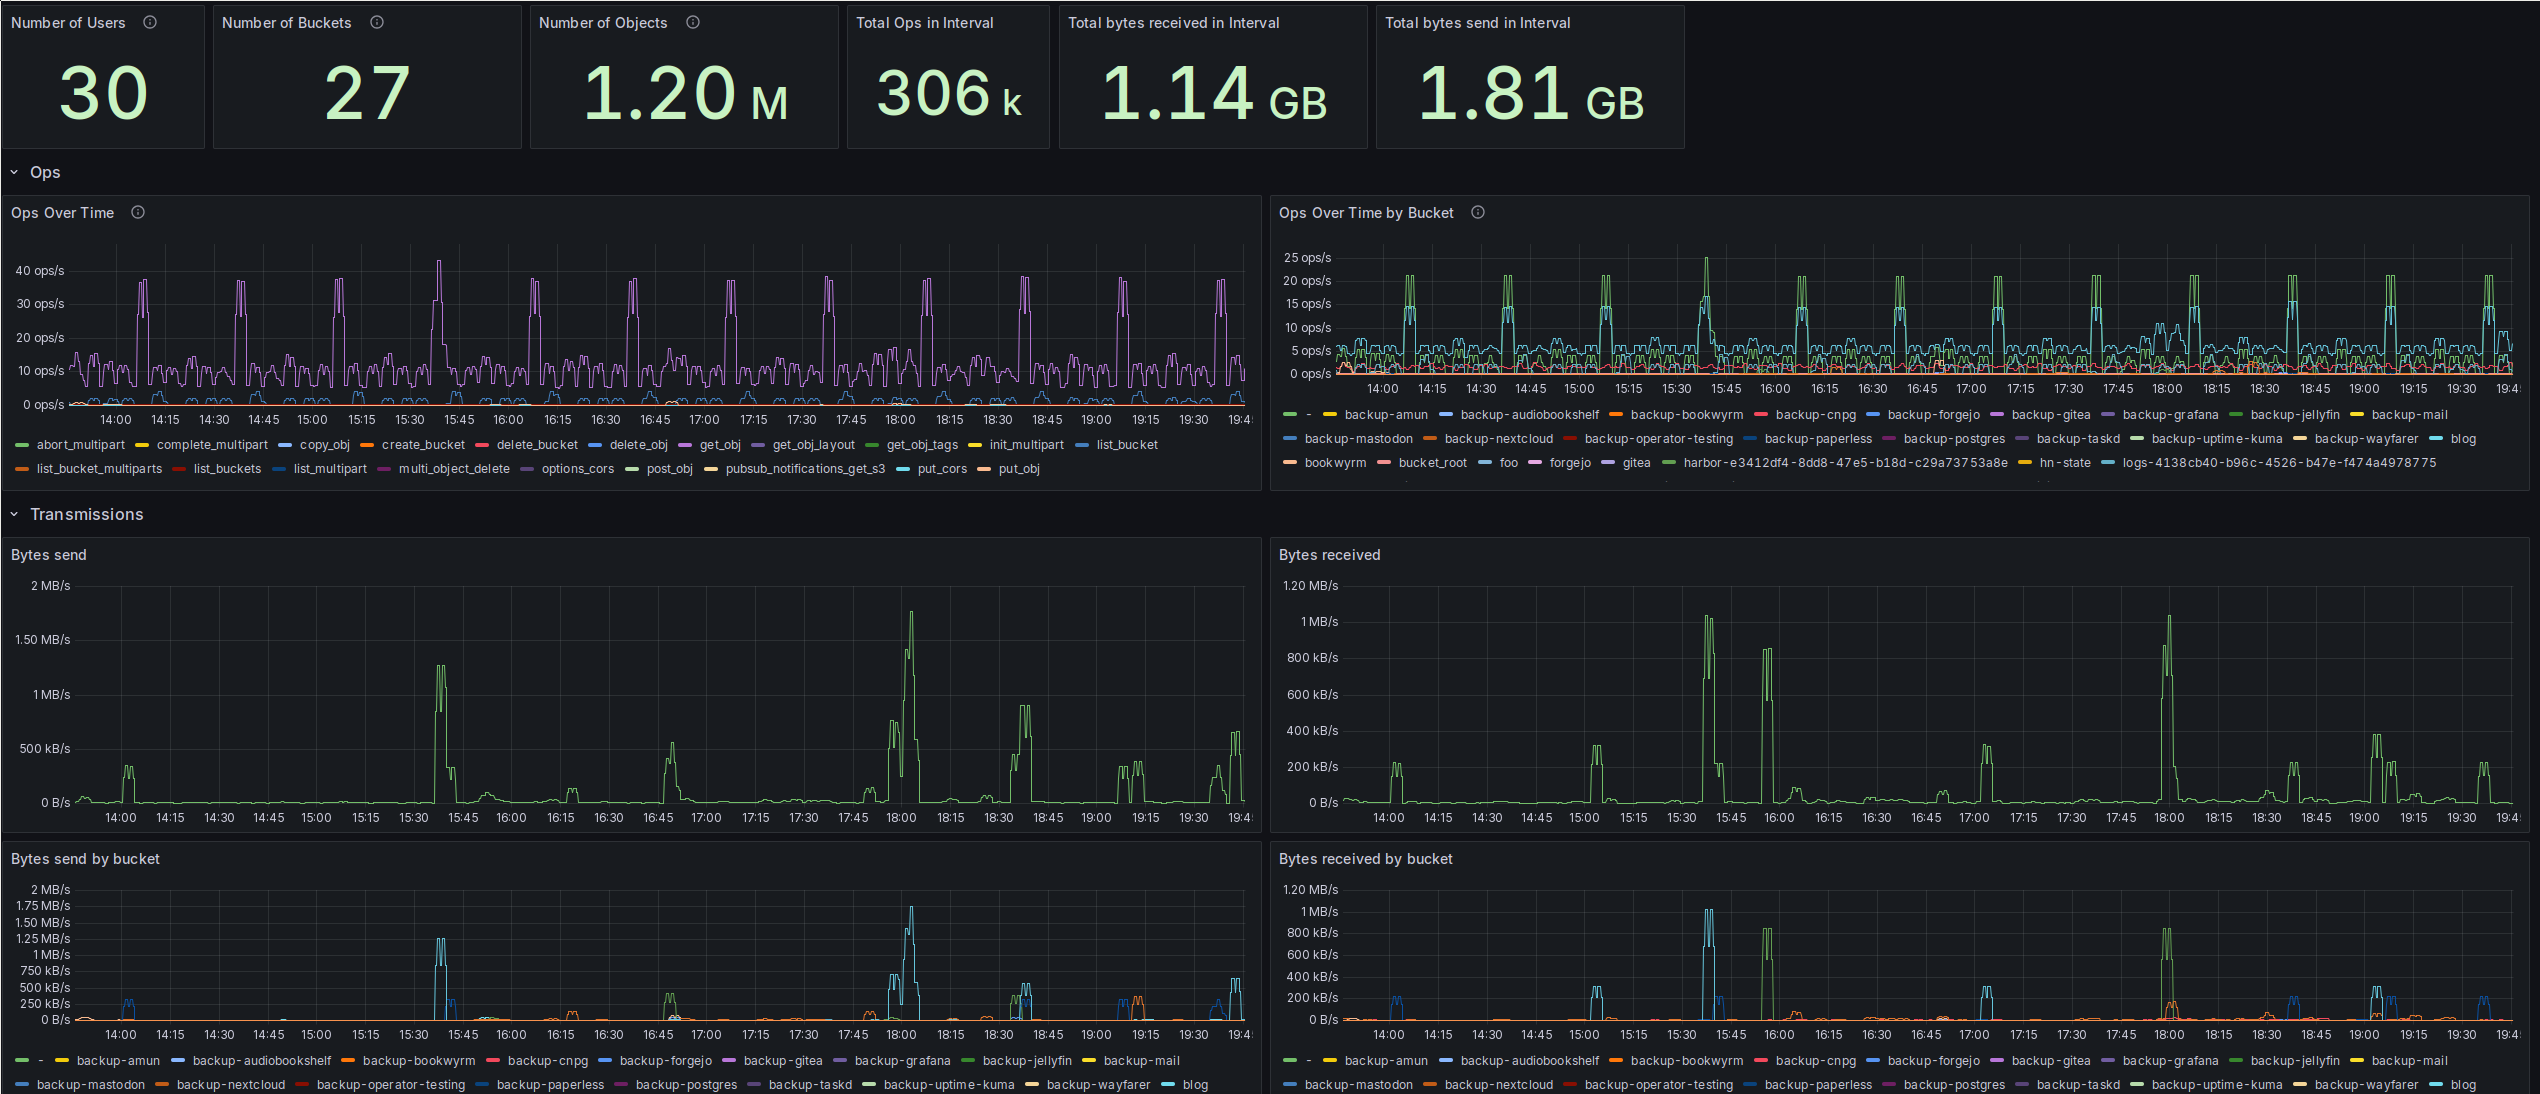
At the top of my dashboard, I’ve got a few overall figures in Grafana stats
panels: The top of my dashboard, with a couple of overall figures on all S3 buckets.
These are configured with the following PromQL queries:
- Number of Users:
sum(count(radosgw_user_metadata) by (user)) - Number of Buckets:
sum(count(radosgw_usage_bucket_objects) by (bucket)) - Number of Objects:
sum(radosgw_usage_bucket_objects) - Total Ops in Interval:
sum(increase(radosgw_usage_ops_total[$__range])) - Total bytes received in Interval:
sum(increase(radosgw_usage_received_bytes_total[$__range])) - Total bytes send in Interval:
sum(increase(radosgw_usage_sent_bytes_total[$__range]))
Next up are two panels on the operations the RGW executed in the interval. These are basically the S3 endpoints that got hit. I decided to go with two time series panels, one showing operations accumulated by type over all buckets, and the other showing operations per bucket, accumulated over all types of operation.

Plots for operations, showing the ops/s by type and by bucket.
The per-operation plot is created with this PromQL query:
sum(rate(radosgw_usage_ops_total[5m])) by (category)
And the per-bucket plot with this one:
sum(rate(radosgw_usage_ops_total[5m])) by (bucket)
These two plots nicely show which apps produce the highest S3 load in my Homelab.
The highest load, with about 5 ops/s on average, is coming from Thanos. Meaning
my metrics gathering is the highest S3 user by operations in my Homelab. Surprising
exactly nobody, I assume. 😅
Next comes this weird - bucket, which I still cannot explain. But it might have
something to do with Thanos as well, as it seems to follow a similar pattern as
the Thanos bucket requests?
The final consistent user is the CloudNativePG backup, which produces about
1.5 ops/s.
It really should make me feel a bit queasy that the largest user of my S3 is my metrics gathering. Yet somehow, I don’t care even a bit. 😁
Next are the transmission plots, with bytes send and received: Plots for bytes send and received by the RGWs overall.
The plots are produced with these PromQL queries, starting with the “Bytes send” plot:
sum(rate(radosgw_usage_sent_bytes_total[5m]))
And the “Bytes received” plot:
sum(rate(radosgw_usage_received_bytes_total[5m]))
Then I’ve got the same plots, but now grouped by buckets receiving/sending the
bytes: Plots for bytes send and received, this time accumulated by bucket.
Both of the above plots were produced similar to the previous combined plots,
just with an additional by clause:
# Bytes send
sum(rate(radosgw_usage_sent_bytes_total[5m])) by (bucket)
# Bytes received
sum(rate(radosgw_usage_received_bytes_total[5m])) by (bucket)
The next two plots are showing the size of the buckets over time, both in bytes
and in objects: Plots for the size of my buckets, both in bytes and number of objects.
# Usage in bytes
radosgw_usage_bucket_bytes
# Number of objects
radosgw_usage_bucket_objects
Exciting, right? 😉
The “area chart” look can be controlled by the “Fill opacity” in the “Graph styles” section of the chart’s configuration, and stacking can be enabled by setting “Stack series” to “normal” in that same section.
Last, but certainly not least, here are some bar charts with the latest sizes of
my largest buckets: Plots showing bar charts with the newest values for size in bytes and number of objects.
On the number of objects side of things, I was a bit surprised to see that the top three are completely different from the size in bytes top three. But it makes sense here, although I plan to look into Loki’s configuration a bit, there has to be a lot of overhead for producing that many objects. Mastodon is not surprising at all, it just produces a lot of small objects in the cache. I was a bit surprised by Bookwyrm though, as that doesn’t just have a large bunch of user-generated media to cache.
Finally, the PromQL for the two plots:
# Size in bytes plot
sort_desc(radosgw_usage_bucket_bytes)
# Size in bytes plot
sort_desc(radosgw_usage_bucket_objects)
A bit of analysis
Now that the dashboard has been described in the excruciating detail my readers love and expect, let’s turn to getting a bit more out of it than just “uuuuh, look at those pretty charts!”.
The first interesting result is related to my nightly backups. As a reminder, I’m using restic to push the content of my volumes into the Ceph S3 buckets, with one bucket per app. After that’s done for all of my apps, I’m copying some of those buckets onto an external HDD. I’m currently lacking a third, offsite backup. If you’re interested in more details, have a look at this post.
I’ve now found that I’m not bandwidth, but instead operations-limited, or that’s
at least the way it looks. Operations during my backup phase.
The second, more balanced spike around 04:30 is my external backup. Here I’m copying some of the backup buckets onto an external HDD, treating that as a separate “medium”.
During the same period, the actual number of bytes send and received was pretty
low: Bytes send and received during my backups.
Another thing worth mentioning is the total lack of any receiving activity around the time of my external backup, 04:30. That’s most likely due to the nature of that backup, as it’s only downloading the content of the backup buckets, but not uploading anything.
The last thing I’d like to bring up is the CloudNativePG backup bucket. I was honestly pretty surprised that it’s this big, at over 600 GB by the time I looked at the charts for the first time. So I went spelunking a little bit and found pretty quickly that it’s the Write Ahead Log (WAL). For example, my Bookwyrm DB backup looks like this:
s3cmd du -H "s3://backup-cnpg/bookwyrm-pg-cluster/wals/"
94G    6079 objects s3://backup-cnpg/bookwyrm-pg-cluster/wals/
s3cmd du -H "s3://backup-cnpg/bookwyrm-pg-cluster/base/"
 3G      62 objects s3://backup-cnpg/bookwyrm-pg-cluster/base/
The way CloudNativePG’s backups work is that it continuously writes the WALs to the backup, and taking a full base backup of the database files at configurable points in time. I took the above example output at the beginning of October, where I had Bookwyrm running for barely a month. And I already had 94 GB of WALs in the backup. Sure, the system is great, as it allows me to restore to any point in time. But to be honest, I don’t really need that kind of granularity. Just a nightly backup would be fine for me. But sadly, that’s not something configurable, at least as far as I could see.
So looking around, I found that I could enable compression for the WALs before they get uploaded to the bucket, see the docs here.
And that brought quite some improvement. Here is an example from the Mastodon backups:
2025-10-04 16:36    16M  s3://backup-cnpg/mastodon-pg-cluster/wals/00000020000000F3/00000020000000F300000098
2025-10-04 16:41    16M  s3://backup-cnpg/mastodon-pg-cluster/wals/00000020000000F3/00000020000000F300000099
2025-10-04 16:46    16M  s3://backup-cnpg/mastodon-pg-cluster/wals/00000020000000F3/00000020000000F30000009A
2025-10-04 16:51    16M  s3://backup-cnpg/mastodon-pg-cluster/wals/00000020000000F3/00000020000000F30000009B
2025-10-04 16:56   248K  s3://backup-cnpg/mastodon-pg-cluster/wals/00000020000000F3/00000020000000F30000009C.bz2
2025-10-04 17:01   795K  s3://backup-cnpg/mastodon-pg-cluster/wals/00000020000000F3/00000020000000F30000009D.bz2
2025-10-04 17:06   308K  s3://backup-cnpg/mastodon-pg-cluster/wals/00000020000000F3/00000020000000F30000009E.bz2
2025-10-04 17:11   377K  s3://backup-cnpg/mastodon-pg-cluster/wals/00000020000000F3/00000020000000F30000009F.bz2
2025-10-04 17:16   831K  s3://backup-cnpg/mastodon-pg-cluster/wals/00000020000000F3/00000020000000F3000000A0.bz2
2025-10-04 17:21   421K  s3://backup-cnpg/mastodon-pg-cluster/wals/00000020000000F3/00000020000000F3000000A1.bz2
2025-10-04 17:26  1172K  s3://backup-cnpg/mastodon-pg-cluster/wals/00000020000000F3/00000020000000F3000000A2.bz2
Other databases of course don’t produce remotely this many WALs, as there’s nothing
as active as Mastodon in my Homelab. But the improvement is rather clear. I
opted for bzip2 compression, and it reduced the per-WAL size from pretty consistent
16 MB to mostly below 1 MB. This is quite amazing. And there don’t seem to be
any costs associated on the computational side, looking at the CPU utilization
of the barman cloud plugin containers running next to each Postgres container: CPU utilization of the plugin-barman-cloud container, which is a sidecar to each CNPG postgres container.
And if you’re curious, at the time of writing, I’m down to 505 GB for the CNPG backup bucket, from over 600 GB.
But the reduction in storage utilization wasn’t the only effect. It also reduced
the load on the RGW cluster. These are the bytes received for the evening I
switched over to compression for the WAL backups: Bytes received for the RGW cluster, with me switching my CNPG clusters over to compressed WAL backups at around 19:00.
From a base load of about 280 kB/s to a mere ~1.1 kB/s. A quite nice reduction in resource usage.
And that’s it folks. I hope you will forgive me the geeking out over metrics and were able to enjoy the pretty charts.
(yes, about halfway through this post, I finally realized that “chart”, not “plot” or “graph”, was the word I was looking for. 😅)