Over the weekend, I migrated one of the Ceph VMs in my Homelab over to a physical host. This time around, instead of buying a completely new machine, I recycled most of my old 2018 era home server. It’s an old AMD A10-9700E, meaning the 35W TDP variant.
I have noted some thoughts on reusing this old machine here.
Mounted in the rack, the machine looks like this:
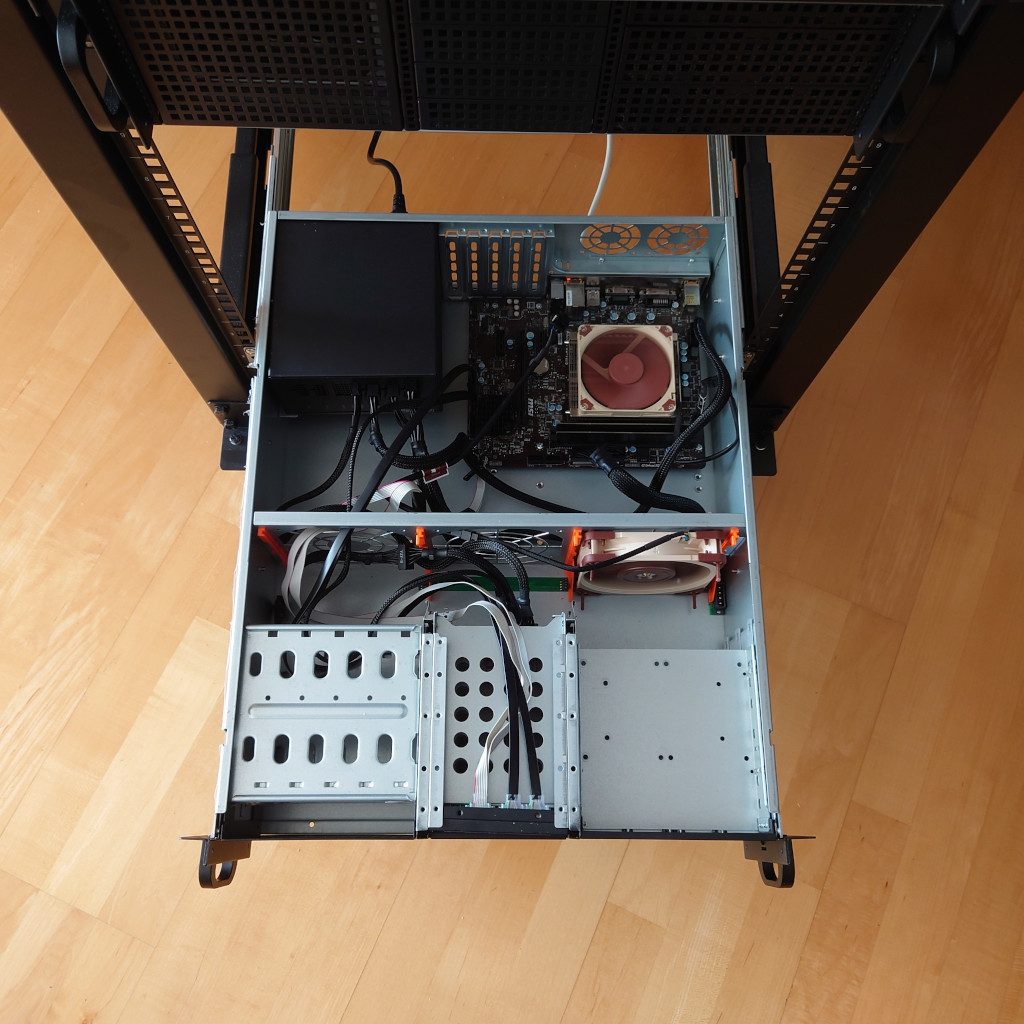
Server mounted in the rack, without Ceph OSD disks attached.
The setup went as always. First generating an Ubuntu based image with Packer.
Again pretty funny: The Qemu provisioner for Packer takes a bock-standard
install medium. Those install mediums generally require at least some input
from the user. And Packer just provides a list of strings for the commands it
will then send to the VM’s stdin to be entered into any prompts. You can also
sprinkle some wait into the list of commands to make sure the right input
field is present before Packer starts “typing”. :beaming_face_with_smiling_eyes:
That went extremely smoothly this time around. I believe this was the first time since starting to use Packer and Ansible for deployments where I did not have to fiddle with the bootstrapping playbook while creating and deploying the new host. :grinning_face:
Putting it all into the case also went pretty well. This time, I bought the right length of rails and also configured them right from the beginning. No sticking out of the rack for this server. As always when it comes to rails and my Homelab, there was a problem though: I had done a test fitting before putting in the components, to make sure I got the rails right. And afterwards, I wasn’t able to get the case dismounted again.
I now know two things: I really don’t like mounting rails. And I can actually build an entire machine while the case is already mounted. Although my back insisted that I don’t do that again anytime soon. :grinning_face_with_sweat:
Ceph migration
If there’s one thing which annoys me every time with Ceph, it is that there’s no good way to take disks out of one host, putting them into another, and then getting the disks and their content reused by a fresh OSD. So every time I switch hosts, I have to remove the OSDs from one host, wait for re-balancing to finish, and put them in the other host and then wait for more or less the same data as was on there before getting written to the disk again.
But when searching the web, pretty much everyone runs into problems when they somehow try to work around this limitation. And if there’s one thing I don’t want to look like it came right out of Frankenstein’s lab, it’s my storage daemons.
So OSD removal it was. And that took over one day. Even though there was only a single digit number of Terabytes to transfer. What would happen when an OSD is removed from a Ceph cluster is a recovery operation. This operation takes all the placement groups on the removed OSDs and migrates them to other OSDs. As I only have six OSDs in my cluster (three large HDD, three smaller SSD) and a replication factor of two, I would expect this to go relatively fast. But it didn’t.
And that is the problem I would like to dig into a bit. I started the OSD removal
of the old OSDs with a ceph orch host drain command on Friday, 13:45h. It was
done on Sunday morning, 00:50h.
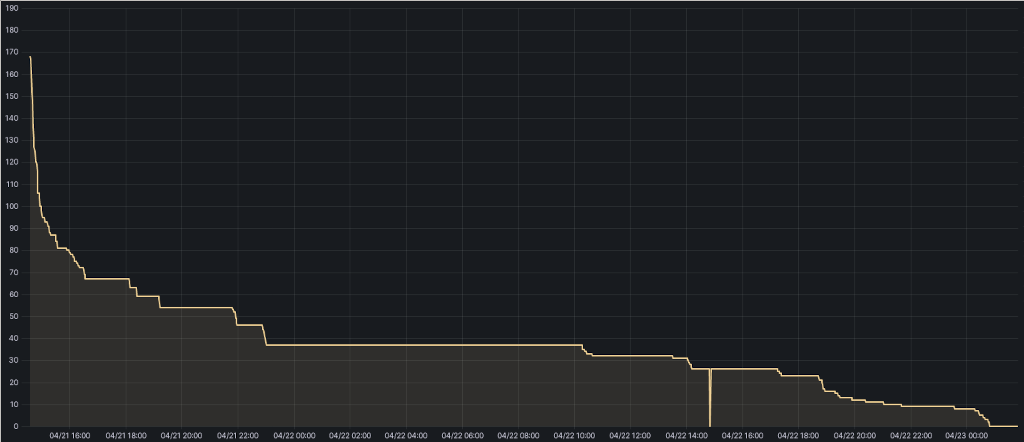
The number of Placement groups in the ‘remapped’ state over time.
The initial rapid remapping of PGs is when the SSD OSD got cleared. After that, with the HDD OSD, the remapping rate fell precipitously.
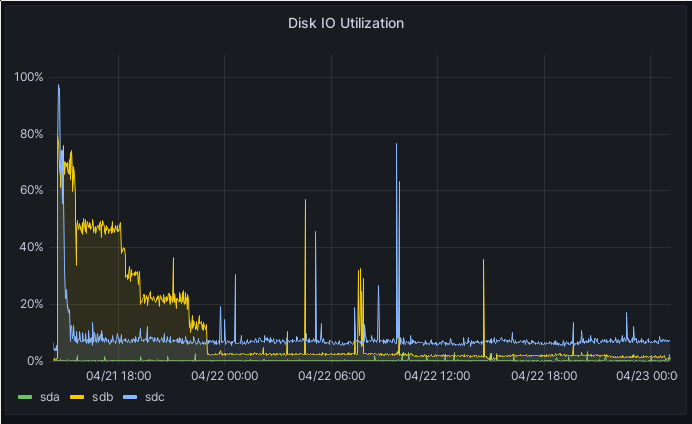
Disk IO utilization on one of the Ceph hosts which received the PGs from the draining host
The picture above is representative of the situation on all three hosts involved in the re-balancing. In the beginning, all disks run near 100%, capped by my 1 Gbps network. But after a while, the performance fell further and further down, until I saw only a max of 10 MB/s on Saturday morning. The other resources look similar. Network was not bottlenecked, CPU was pretty low (and no core was pegged at 100%), and disk IO was minimal on all three hosts.
Swapping disks
This morning, after the migration was finally done, I switched the disks from the old server to the new one. One problem I had foreseen was how to determine which disks to pull. The server has six, and I only wanted two of them.
I finally found the solution in looking at /dev, specifically the
/dev/disk/by-path directory. The result looks something like this:
lrwxrwxrwx 1 root root  9 Apr 23 10:37 pci-0000:00:17.0-ata-2 -> ../../sda
lrwxrwxrwx 1 root root  9 Apr 23 10:37 pci-0000:00:17.0-ata-2.0 -> ../../sda
lrwxrwxrwx 1 root root  9 Apr 23 10:37 pci-0000:00:17.0-ata-3 -> ../../sdb
lrwxrwxrwx 1 root root 10 Apr 23 10:37 pci-0000:00:17.0-ata-3-part1 -> ../../sdb1
lrwxrwxrwx 1 root root 10 Apr 23 10:37 pci-0000:00:17.0-ata-3-part2 -> ../../sdb2
lrwxrwxrwx 1 root root 10 Apr 23 10:37 pci-0000:00:17.0-ata-3-part3 -> ../../sdb3
lrwxrwxrwx 1 root root  9 Apr 23 10:37 pci-0000:00:17.0-ata-3.0 -> ../../sdb
lrwxrwxrwx 1 root root 10 Apr 23 10:37 pci-0000:00:17.0-ata-3.0-part1 -> ../../sdb1
lrwxrwxrwx 1 root root 10 Apr 23 10:37 pci-0000:00:17.0-ata-3.0-part2 -> ../../sdb2
lrwxrwxrwx 1 root root 10 Apr 23 10:37 pci-0000:00:17.0-ata-3.0-part3 -> ../../sdb3
lrwxrwxrwx 1 root root  9 Apr 23 10:37 pci-0000:00:17.0-ata-4 -> ../../sdc
lrwxrwxrwx 1 root root 10 Apr 23 10:37 pci-0000:00:17.0-ata-4-part1 -> ../../sdc1
lrwxrwxrwx 1 root root 10 Apr 23 10:37 pci-0000:00:17.0-ata-4-part2 -> ../../sdc2
lrwxrwxrwx 1 root root 10 Apr 23 10:37 pci-0000:00:17.0-ata-4-part3 -> ../../sdc3
lrwxrwxrwx 1 root root  9 Apr 23 10:37 pci-0000:00:17.0-ata-4.0 -> ../../sdc
lrwxrwxrwx 1 root root 10 Apr 23 10:37 pci-0000:00:17.0-ata-4.0-part1 -> ../../sdc1
lrwxrwxrwx 1 root root 10 Apr 23 10:37 pci-0000:00:17.0-ata-4.0-part2 -> ../../sdc2
lrwxrwxrwx 1 root root 10 Apr 23 10:37 pci-0000:00:17.0-ata-4.0-part3 -> ../../sdc3
lrwxrwxrwx 1 root root  9 Apr 23 10:37 pci-0000:00:17.0-ata-8 -> ../../sdd
lrwxrwxrwx 1 root root  9 Apr 23 10:37 pci-0000:00:17.0-ata-8.0 -> ../../sdd
The number after the -ata is the SATA port on the mainboard to which the drive
is connected. Or at least it should be. In my case, I got lucky. The numbers
corresponded perfectly to the silk screen on the board, and I was able to
identify the disks I needed to pull this way.
Still, a tip: Just unplug the disk you think you want to pull and then boot the machine, just to make sure. I had read the silk screen wrong, and pulled one of the system disks.
After I had installed the drives, I started the same operation as before, just
in reverse: I added the new OSDs to the Ceph cluster with ceph orch daemon add HOSTNAME:/dev/sdX.
And again, I was greeted with anemic backfill rates of around 10MB/s after the SSD was filled.
I checked the two config values I had used before, osd_recovery_max_active and
osd_max_backfill, but they were still set to 40. And yet, I only saw a few
PGs being remapped at a time. It turns out that there’s a new(ish) scheduler in
Ceph, dmlock.
With this new scheduler, profiles were introduced, which override the
aforementioned settings. And this scheduler has a high_recovery_ops profile.
Switching it on with ceph config set osd osd_mlock_profile high_recovery_ops
increased the throughput…to a still pretty bad 20 MB/s. Digging further, I
found the osd_mclock_override_recovery_settings option. Switching this one to
true then finally gave me the about 60 MB/s I would expect at a minimum, after
setting the osd_max_backfill and osd_recovery_max_active options I mentioned
above again. But even that didn’t last too long. While writing these lines, the
recovery rate has fallen back to about 35 MB/s.
And I still don’t know why Ceph doesn’t use more of the available resources. Sure, I can understand leaving some resources on standby, just in case more client requests show up. But this much? In theory, I should be reaching about 120 MB/s, which is the max of both my 1 Gbps LAN and my HDDs.
Instead of writing this blog post, I really should have made it a mailing list post on the Ceph mailing list. I’m reasonably sure that I’m doing something fundamentally wrong here.
If any of you have a good hint, I would be very happy to hear it.