A couple of weeks ago, I migrated my Jellyfin instance to my Kubernetes cluster. This involved copying my approximately 1.7 TB worth of media from the baremetal Ceph cluster to the new Rook Ceph cluster. And I’d like to dig a bit into the metrics and try to read them like the entrails of a slain beast during a full moon at the top of a misty mountain. Just this much, the portents don’t look good for one of my HDDs.
So come and join me while we find out together whether I can press 30 minutes worth of blog post out of a single rsync command. 🤓
UPDATE: Hey look there, another victory for project “articles, not tomes”: 17 minutes. 🎉
Setting the table
So what are we looking at today? The story of me executing this command:
rsync -av --info=progress2 --info=name0 /mnt/baremetal/* /mnt/rook/
This command takes my entire media collection and copies it from my baremetal Ceph cluster to my Rook ceph cluster. This copy involves four physical hosts, four HDDs, a 1 Gbps switch, two VMs and a Kubernetes cluster. The final output from the command looks like this:
sent 1,748,055,479,314 bytes  received 155,334 bytes  54,890,039.24 bytes/sec
total size is 1,853,006,549,228  speedup is 1.06
Overall, this took about 9 hours. Now, that 54 MB/s might not look too impressive, even for spinning rust. This is, at least partially, just due to the way Ceph works. Any write is first done to a WAL, which means there’s some extra IOPS required besides the write of the actual data. Plus there was some other IO going on at the same time, and while that’s generally pretty low-level in my cluster, it still costs IOPS.
But of course, we’re in Meier’s Homelab here. We don’t need to read tea leaves. We have 200 GB worth of Prometheus TSDB around here.
It ain’t looking good
Before diving into the metrics, there’s one problem to note: You will be seeing that there are holes in the metrics. Quite a lot of them, in fact. Those are there because while the copy operation was running, the Prometheus Pod was restarted multiple times. I caught this at the beginning of the copy process. Looking at the Pod, it got automatically restarted due to the liveness probe failing. After every restart, it took quite a while to come up again. And I’m pretty sure that’s because of the copy operation. The volume Prometheus is using is located on the same HDD pool that the media collection was getting copied to. And as you will see later, those HDDs were completely slammed by the copy operation. Which is okay in general, of course. Ceph should be using all the IOPS available to it.
But I found myself a bit disappointed, to be honest. I would have expected that there was some good IO scheduling going on in Ceph. But seemingly, it allowed other IO operations to be starved to such a degree that Prometheus repeatedly (as in: dozens of times) failed its liveness probe. In the Ceph logs, I saw messages about IOPS being delayed for up to 90 seconds. It didn’t really break anything, and the cluster stayed up through all of it - it was just that some disk operations were really slow. So I’m not ditching Ceph or anything like that. I might even be wrong with my assumptions - it might not have been IO contention, but instead network contention. But I will definitely be looking a bit deeper into which knobs I can tune in Ceph’s scheduling behavior. And also into throwing some further SSDs into my Ceph hosts to serve as RocksDB/WAL storage for my HDD OSDs. But then there’s actually the problem that one of my Ceph hosts is an Odroid H3, which only has two SATA ports. 🙄
But finally enough with the text - let’s move to the plots!
I/O
Let’s begin by having a look at the IO utilization on the disks involved. As I’ve noted above, they’re all HDDs. Two 2016 WD Red 4 TB, both in the baremetal cluster, so they will only get read operations. Then two Seagate platters, one with 8 TB and one with 4 TB. Those are the disks which are getting written to.
Let’s start with a look at the IO of the two source HDDs: I/O utilization of the two source HDDs on the baremetal cluster.
rate(node_disk_io_time_seconds_total{instance="hostA",device="sdb"}[1m])
rate(node_disk_io_time_seconds_total{instance="hostB",device="sdd"}[1m])
So this is the percentage of time both HDDs spend actually serving IO. In contrast to what I noted above, I ended up deciding to enable Grafana’s “Connect null values” option instead of leaving in the holes created by Prometheus being restarted. You can see a pretty large gap at the beginning of the plots, from roughly 23:32 to 00:00. That’s where I initially wanted to look at the metrics while the copy was running, but Grafana sending queries to Prometheus was what made the liveness probes fail for the first time, and me insisting that this should work was what increased the length of the data gap, when compared to the others strewn throughout the plots. Two things are noteworthy about this plot. First, the time where the I/O suddenly increases, from 04:00 to 07:50 or thereabouts. That wasn’t a sudden increase in the write throughput on the receiving cluster, but rather just the fact that I’ve got Ceph’s scrubs configured for that time range. And forgot to disable them for the occasion. Second, note that at no point were the source HDDs actually fully loaded. So the bottleneck wasn’t the read speed.
So what did the two target disks’ utilization look like? So glad you asked. 😁 I/O utilization of the two target HDDs on the Rook cluster.
But let’s first take a look at the disk hovering around 30%, because here I
believe I’ve made a mistake. This disk sits in my old home server, which I reactivated
for the Kubernetes migration to provide some extra capacity. The issue now is: The
Pod doing the copying from the baremetal cluster to the Rook cluster was sitting
on a different VM on the same host. And the physical host is only connected to
the rest of the network, including the 100% disk and the two source disks,
with a 1 Gbps link. So let’s see whether this might have been the bottleneck,
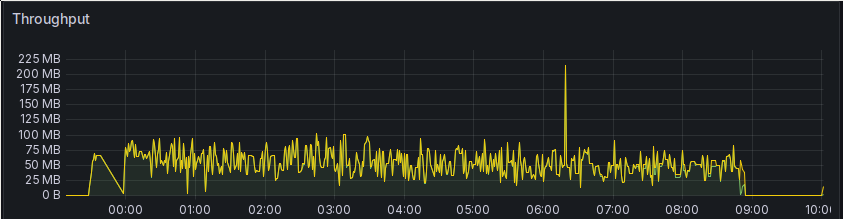
by looking at the network activity of that physical host during the copy operation: Network activity for the physical 1 GbE interface connecting the VM host running one HDD OSD and the Pod running the actual transfer with the other three Ceph hosts.
One simple explanation could be: The Ceph pool I’ve been writing to is a 2x replicated pool. So each piece of data needs to be written to both HDDs. And if one of the HDDs gets completely slammed, the other HDD would not be able to write at its maximum speed because it wouldn’t be able to write the second copy of the data fast enough. I hope I remember this theory when I’m done with the migration and I integrate the two baremetal Ceph hosts and their disks back into the Rook cluster. I will discuss the problematic disk/host a bit more later.
But before that, let’s take a look at write/read I/O load on the HDDs involved
in the copy, starting with the read speeds on the source HDDs: Read rate of the two source HDDs during the copy operation.
So then let’s take a look at the write rates on the two hosts receiving the data: Write rate of the two target HDDs during the copy operation.
Bad disk?
Let’s think back to that one receiving disk that got slammed with 100% IO utilization
and still only had about 60 MB/s write throughput. I think that disk is either
just bad, or mine is somewhat broken? After seeing the above performance, I
decided to take a look at the OSD apply latency in both of my clusters. That’s
the time it takes to flush an update to the disk, after it has been written to
the journal already.
For the disk in question, a Seagate 4 TB 5900 RPM model (ST4000VN008) with 64 MB of cache,
the apply latency looks like this, over the last couple of years since I installed
it in February of 2022: Ceph apply OSD latency for the five OSDs in my baremetal cluster.
Having gotten curious, I ran ceph tell osd.* bench on my Rook Ceph cluster.
Here are the results:
osd.0: {
    "bytes_written": 1073741824,
    "blocksize": 4194304,
    "elapsed_sec": 0.423324704,
    "bytes_per_sec": 2536449713.0788755,
    "iops": 604.7367365548314
}
osd.1: {
    "bytes_written": 1073741824,
    "blocksize": 4194304,
    "elapsed_sec": 0.348712521,
    "bytes_per_sec": 3079160509.9835229,
    "iops": 734.12907361591408
}
osd.2: {
    "bytes_written": 1073741824,
    "blocksize": 4194304,
    "elapsed_sec": 6.0028269730000003,
    "bytes_per_sec": 178872692.62125373,
    "iops": 42.646573214829857
}
osd.3: {
    "bytes_written": 1073741824,
    "blocksize": 4194304,
    "elapsed_sec": 23.502430691000001,
    "bytes_per_sec": 45686415.933615655,
    "iops": 10.892490371135629
}
The two first OSDs are the SATA SSDs, the third one is an 8 TB Seagate HDD and
the last one is the bad HDD. It’s pretty clear that something is wrong here.
The 8 TB Seagate, osd.2, has 4x the IOPS of the 4 TB one. And at least from
all of the other metrics, it does look like IOPS, not e.g. CPU or networking,
is the issue.
Seeing that, I decided to dig even deeper, starting to worry that the disk
might be on its last leg - although it is newer than the two WD Red I’ve got
in the baremetal cluster. And this is what smartctl -a outputs:
ID# ATTRIBUTE_NAME          FLAG     VALUE WORST THRESH TYPE      UPDATED  WHEN_FAILED RAW_VALUE
  1 Raw_Read_Error_Rate     0x000f   081   064   044    Pre-fail  Always       -       134444568
  3 Spin_Up_Time            0x0003   094   094   000    Pre-fail  Always       -       0
  4 Start_Stop_Count        0x0032   100   100   020    Old_age   Always       -       31
  5 Reallocated_Sector_Ct   0x0033   100   100   010    Pre-fail  Always       -       0
  7 Seek_Error_Rate         0x000f   088   060   045    Pre-fail  Always       -       629089568
  9 Power_On_Hours          0x0032   068   068   000    Old_age   Always       -       28425 (215 100 0)
 10 Spin_Retry_Count        0x0013   100   100   097    Pre-fail  Always       -       0
 12 Power_Cycle_Count       0x0032   100   100   020    Old_age   Always       -       30
184 End-to-End_Error        0x0032   100   100   099    Old_age   Always       -       0
187 Reported_Uncorrect      0x0032   100   100   000    Old_age   Always       -       0
188 Command_Timeout         0x0032   100   100   000    Old_age   Always       -       0
189 High_Fly_Writes         0x003a   100   100   000    Old_age   Always       -       0
190 Airflow_Temperature_Cel 0x0022   069   058   040    Old_age   Always       -       31 (Min/Max 24/35)
191 G-Sense_Error_Rate      0x0032   100   100   000    Old_age   Always       -       0
192 Power-Off_Retract_Count 0x0032   100   100   000    Old_age   Always       -       13
193 Load_Cycle_Count        0x0032   078   078   000    Old_age   Always       -       45654
194 Temperature_Celsius     0x0022   031   042   000    Old_age   Always       -       31 (0 22 0 0 0)
197 Current_Pending_Sector  0x0012   100   100   000    Old_age   Always       -       0
198 Offline_Uncorrectable   0x0010   100   100   000    Old_age   Offline      -       0
199 UDMA_CRC_Error_Count    0x003e   200   200   000    Old_age   Always       -       0
240 Head_Flying_Hours       0x0000   100   253   000    Old_age   Offline      -       26876 (182 226 0)
241 Total_LBAs_Written      0x0000   100   253   000    Old_age   Offline      -       58866038445
242 Total_LBAs_Read         0x0000   100   253   000    Old_age   Offline      -       472820704309
Look at those raw values for the Read and Seek error rates! 😲
But then I looked at the VALUE and THRESH values and started to be a bit
suspicious. Something wasn’t adding up there, those values were looking okay.
So I started googling and came across this reddit thread,
which explains that these two values are actually multibit.
And applying the right transformation shows the real values:
smartctl /dev/sda -a -v 1,raw48:54 -v 7,raw48:54
ID# ATTRIBUTE_NAME          FLAG     VALUE WORST THRESH TYPE      UPDATED  WHEN_FAILED RAW_VALUE
  1 Raw_Read_Error_Rate     0x000f   081   064   044    Pre-fail  Always       -       0
  7 Seek_Error_Rate         0x000f   088   060   045    Pre-fail  Always       -       0
So it doesn’t look like the disk has any obvious issues. But the IOPS are still absolutely abysmal and worse than the 8TB disk’s.
So what now? I’m not sure. Replace the disk and hope that the replacement fares better? I’m not so sure about that. I’m also still not 100% convinced that it isn’t an issue of the machine it sits in. It started its life as a disk attached to a Raspberry Pi 4. And while the performance didn’t get any worse when I attached it to the Odroid H3, it also did not get any better, at all. Still, I’m not convinced that the host doesn’t have something to do with it.
One obvious solution would be to get a new HDD. Even if the old one is actually fine, I can just use it as a spare in case of catastrophic failure. My main concern for a new disk would be noise - my rack is right next to my desk, where I spend most of my free time. The disk being quiet is pretty high on my list. So a 5400 rpm disk would be the best choice. But: I’ve also just spend several paragraphs complaining about low IOPS on the HDD. And a 7200 RPM disk would definitely have more of those. I’m undecided.
A completely different approach would be going with Ceph’s ability to split WAL/DB and data. In Ceph, each OSD (the daemon which manages a single disk) stores four types of data. The first I will not discuss any further is the OSD’s config data, like it’s Ceph auth key. If this data is lost, the OSD could still be recovered. The WAL, Write Ahead Log, is a couple of GB worth of data that hasn’t been written to the actual file store yet. The third type is the RocksDB, which stores object metadata, like the mappings from object name to object location on disk. The fourth type of data to be stored is the payload itself - the actual data we want to store. Now, when a new piece of data is written, Ceph doesn’t just need to spend the necessary IOPS for writing the payload to the disk, but also the mandatory entry into the WAL and the update/addition of data in the RocksDB. All of that doesn’t just take time and bandwidth, but also and especially IOPS.
By default, and this is what I currently have in both of my Ceph clusters, the WAL and the RocksDB are co-located with the data store on the same spinning disk. So every piece of data is written twice to the same disk - once to the WAL, and once to the main data store. And then there’s the cost for the metadata update on top. Quite a lot of IOPS for a spinning disk. But with the current BlueStore implementation for the Ceph OSDs, the DB/WAL and the actual data storage can reside on different disks. A pretty common strategy seems to be to take the WAL/RocksDB for an HDD OSD and putting it on an SSD. From a sizing perspective, the rule of thumb seems to be to make the WAL/RocksDB drive 4% the size of the OSD’s own disk. And even a SATA SSD can easily take care of multiple OSDs. That would definitely be an interesting option to pursue. SATA SSDs aren’t that expensive anymore, at least for the relatively small sizes I’m thinking about.
But then again, the choice for the Odroid H3 is biting me a bit here - the board only has two SATA connectors, and they’re both already occupied.
I think this is an interesting option, but I will have to think more about it. As the HDD doesn’t seem to have any obvious issue and isn’t throwing any read errors, I’m happy to keep it running. And to be clear, I’m only seeing issues during larger copy operations. In daily use, the I/O utilization only goes above 20% during the nightly scrubs. So it will stay for now.
The Aftermath
On the positive side: I have my media library on the Rook cluster. But there was also a downside I only became aware of a couple of days after the copy, namely this cluster level warning starting to pop up on the Rook cluster:
ceph health detail
Info: running 'ceph' command with args: [health detail]
HEALTH_WARN 1 pgs not deep-scrubbed in time
[WRN] PG_NOT_DEEP_SCRUBBED: 1 pgs not deep-scrubbed in time
    pg 5.17 not deep-scrubbed since 2025-02-06T07:10:51.660560+0000
Deep scrubs are Ceph’s way of ensuring data consistency. The normal scrubs just compare checksums and such, but the deep scrubs compare the actual data between the different copies, so they’re pretty expensive. In my clusters, deep scrubs are allowed to be run in the time between 04:00 and 08:00.
But that time might not always be enough, and deep scrubs have a lower IO priority than normal client access to the OSDs. So during the large copy operation, deep scrubs got so slow that some PGs fell out of the required interval for deep scrubs. This interval is seven days by default.
When this health warning pops up, a deep scrub can be triggered outside the configured time window with this command:
ceph pg deep-scrub 5.17
The PG which needs deep scrubbing is given in the health warning.
In addition, I also had another problem, PGs stuck in deep scrub for a very long time. Cases like this can be identified by running the following command:
ceph pg dump pgs | grep "+scrubbing+deep"
3.1 [...]  deep scrubbing for 214s [...]
If the time given is very large, the scrubbing is likely stuck. I’ve found that the following command helps in these cases:
ceph pg repeer 3.1
Conclusions
Well, as I’ve noted above, I might need to either get a new HDD or start thinking about implementing WAL/RocksDB separation onto an SSD for my HDD OSDs. It isn’t really urgent, but these slow copy operations are still bothering me - although they happen quite infrequently.
Another thing I’ve learned through all of this is that I have to come up with a standard I/O benchmark I apply to disks before creating the OSDs on it. While I do trust the metrics and benchmark results I gave above, there was also a lot of fluctuation in them, and not all runs showed the 4 TB Seagate to be quite so bad.
There’s still a hell of a lot to learn about storage. I’m quite happy with Ceph and definitely don’t want to replace it, but I still feel the need to learn a bit more.
And that’s it for today. Next up for a post will be the migration of my Mastodon instance, which is already done at the time I’m writing these lines.